

Weekend Review and Watchlist
Overview
Despite the noise around the Fed and the prospects of a rate hike in June, not a lot changed this week. Short-term the market is still rangebound, the intermediate uptrend remains intact, and sentiment remains very bearish.
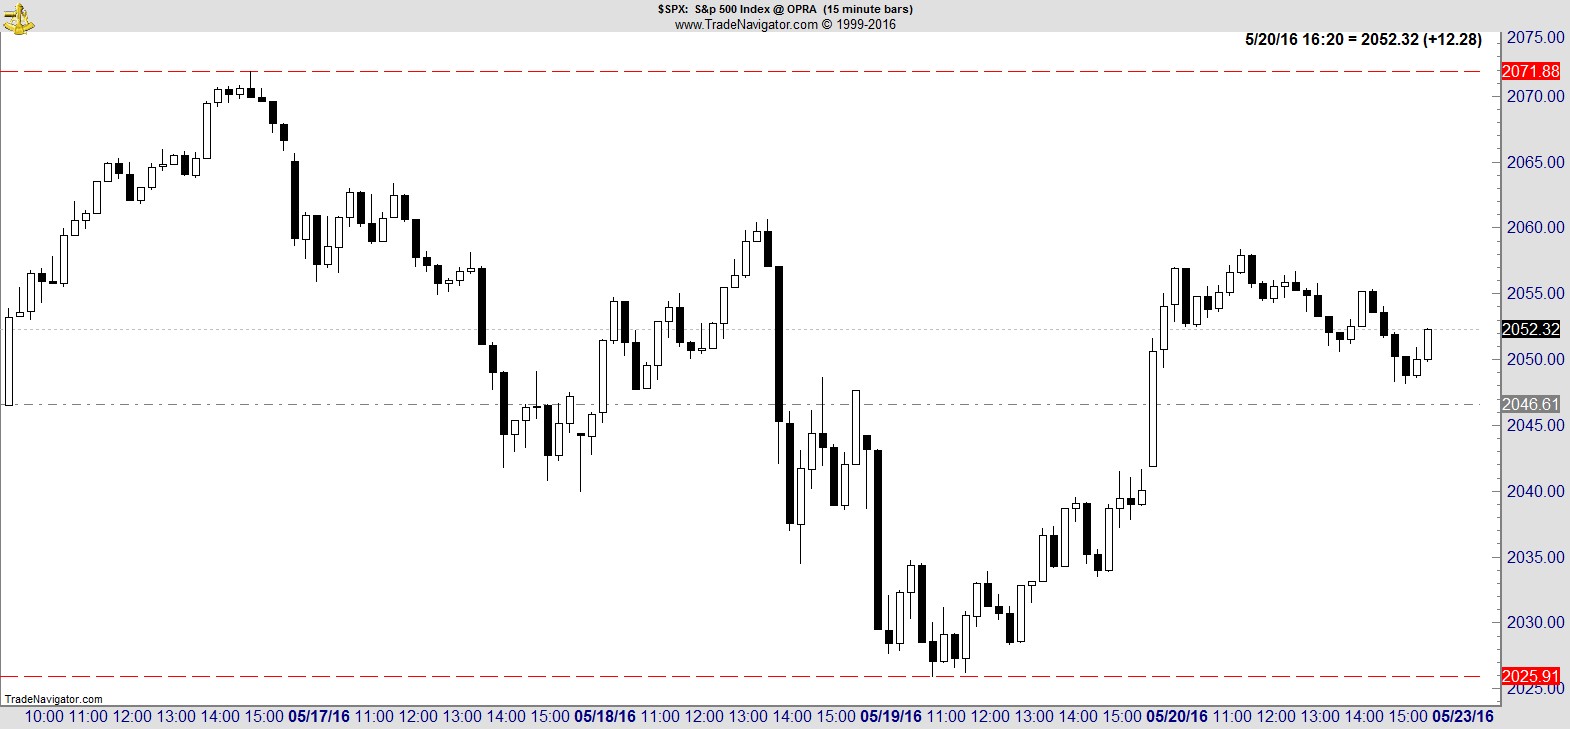
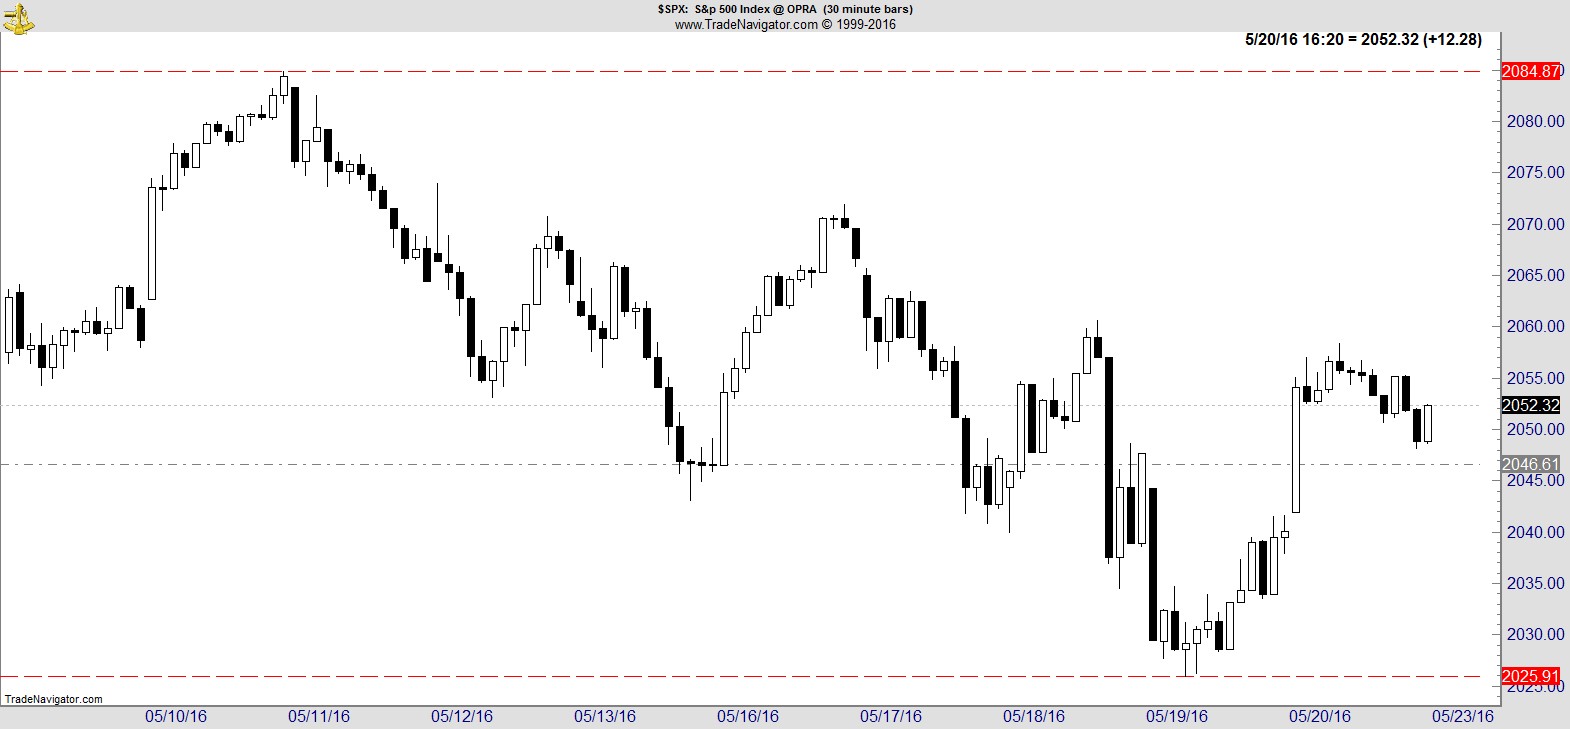
Let's start with a look at the S&P 500 on various timeframes:-
Short-term it finished just above the mid-point of the last 5 days, and just below the mid-point of the last 10 days.
.
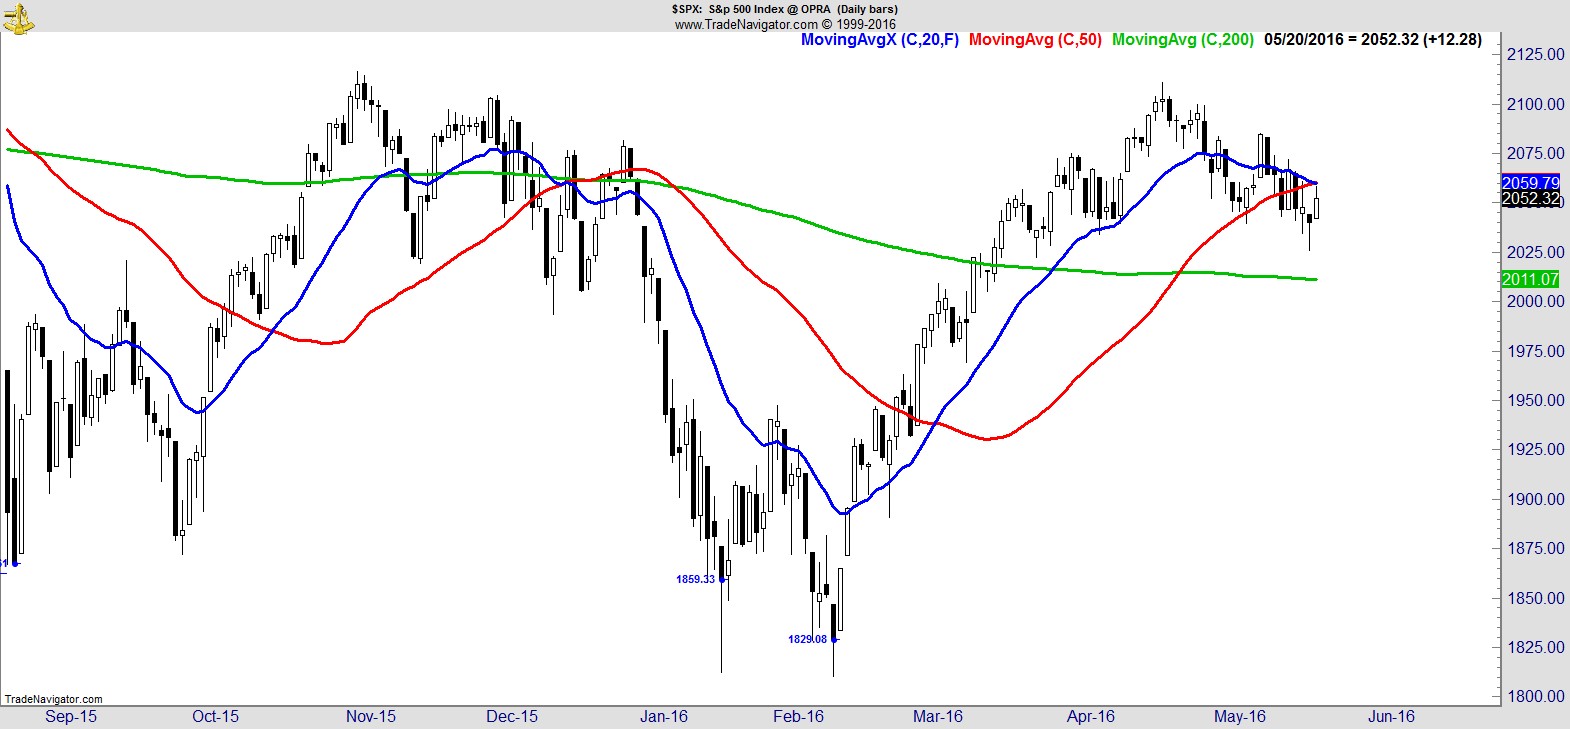
Turning to a daily chart, the intermediate uptrend is intact but under pressure. Price has been edging lower over the last 3 weeks and is unchanged from 8 weeks ago. It's now beneath its 20 and 50-day MAs, but remains above its 200-day.
.
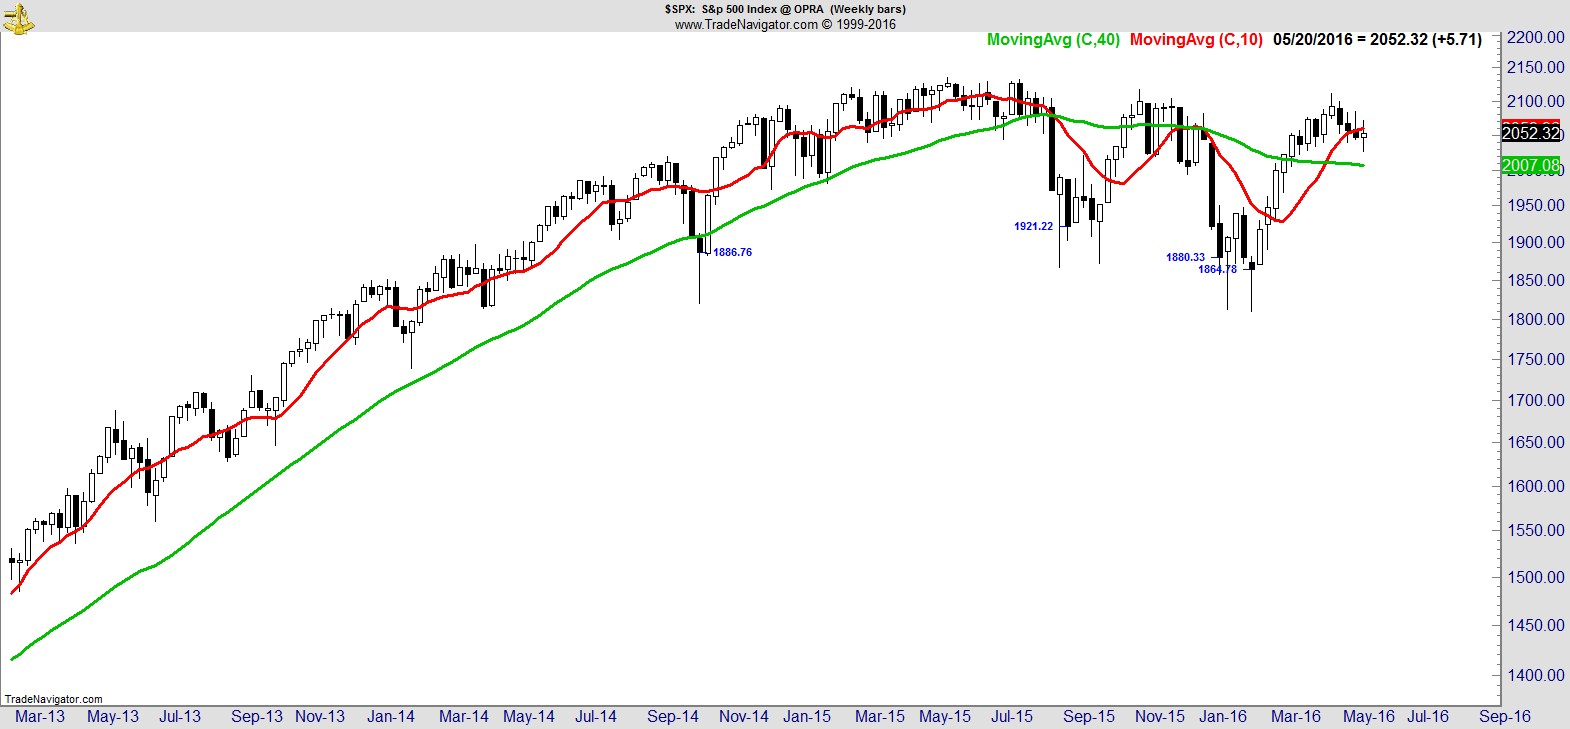
On the weekly chart it made another lower high and lower low, finishing below the 10-wk MA for a second straight week, but for now remains a very modest consolidation of the trend that preceded it. Consider, the S&P is down 1.9% in 4 weeks, having surged 12.2% in 10 weeks.
.
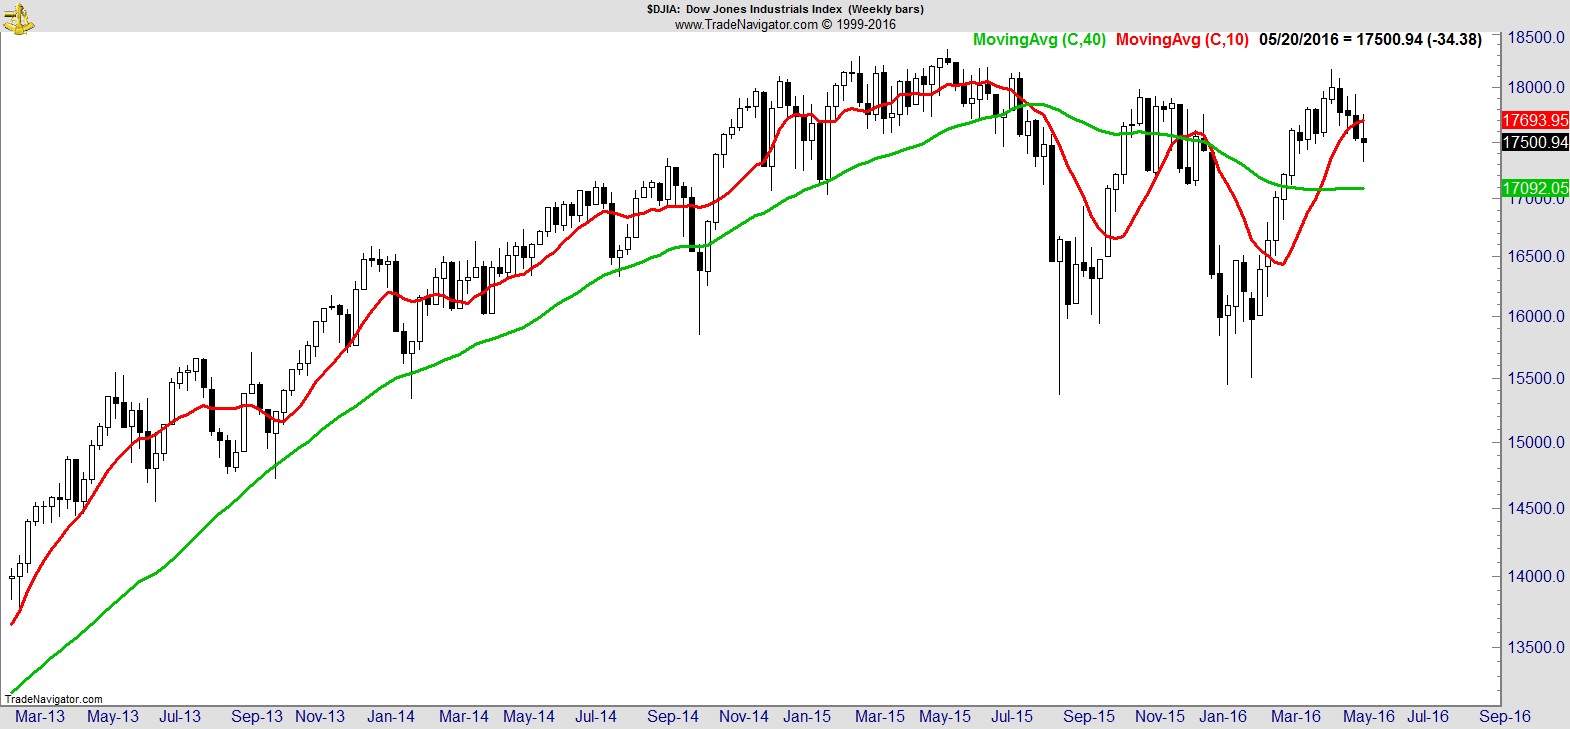
The Dow sports a similar pattern to the S&P:-
.
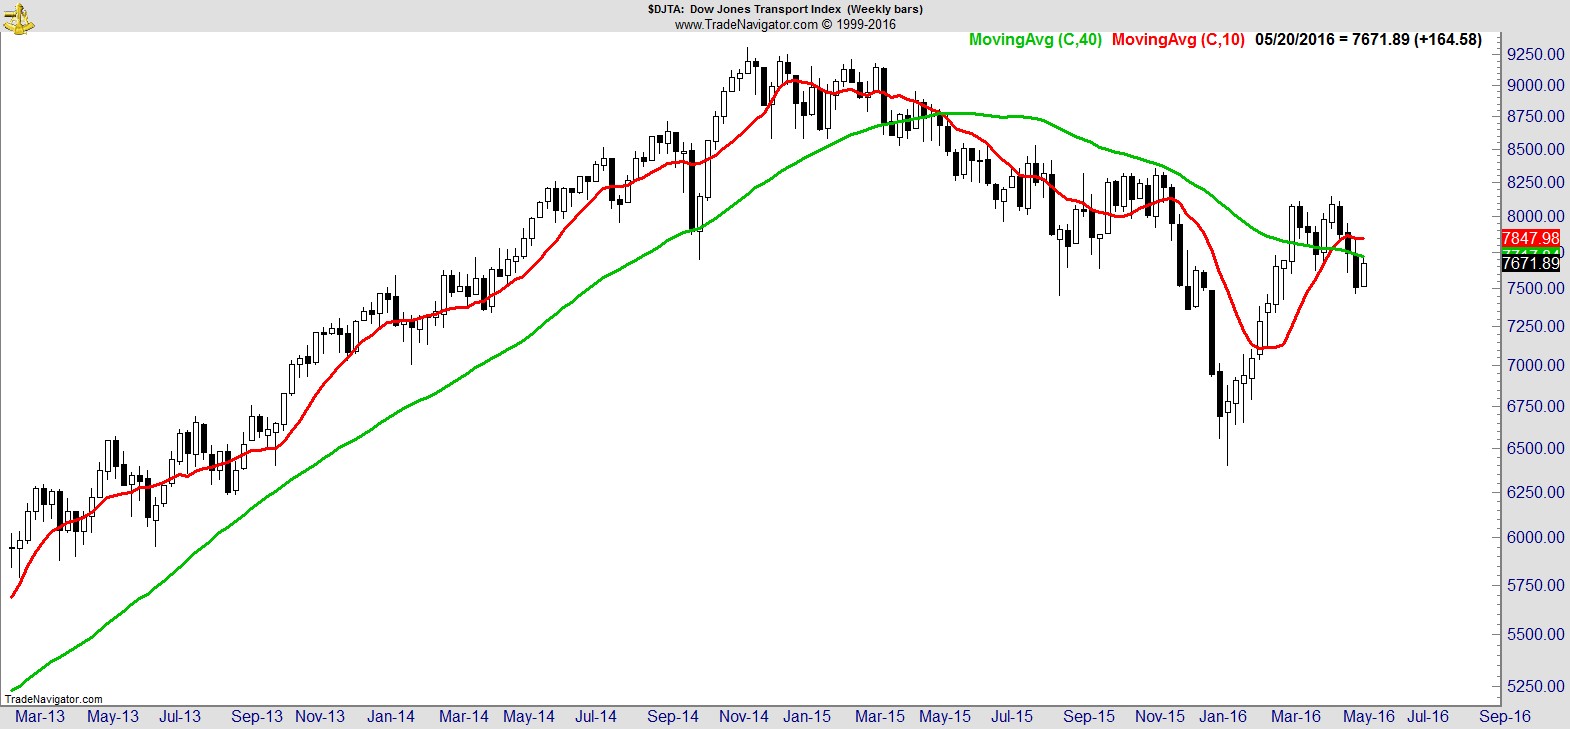
The Transports continues to be one of the more volatile major indices and recovered well from last week's decline to finish just below its MAs. It needs to reclaim 8,085 to establish an intermediate higher high and leave in place last week's close as a higher low.
.
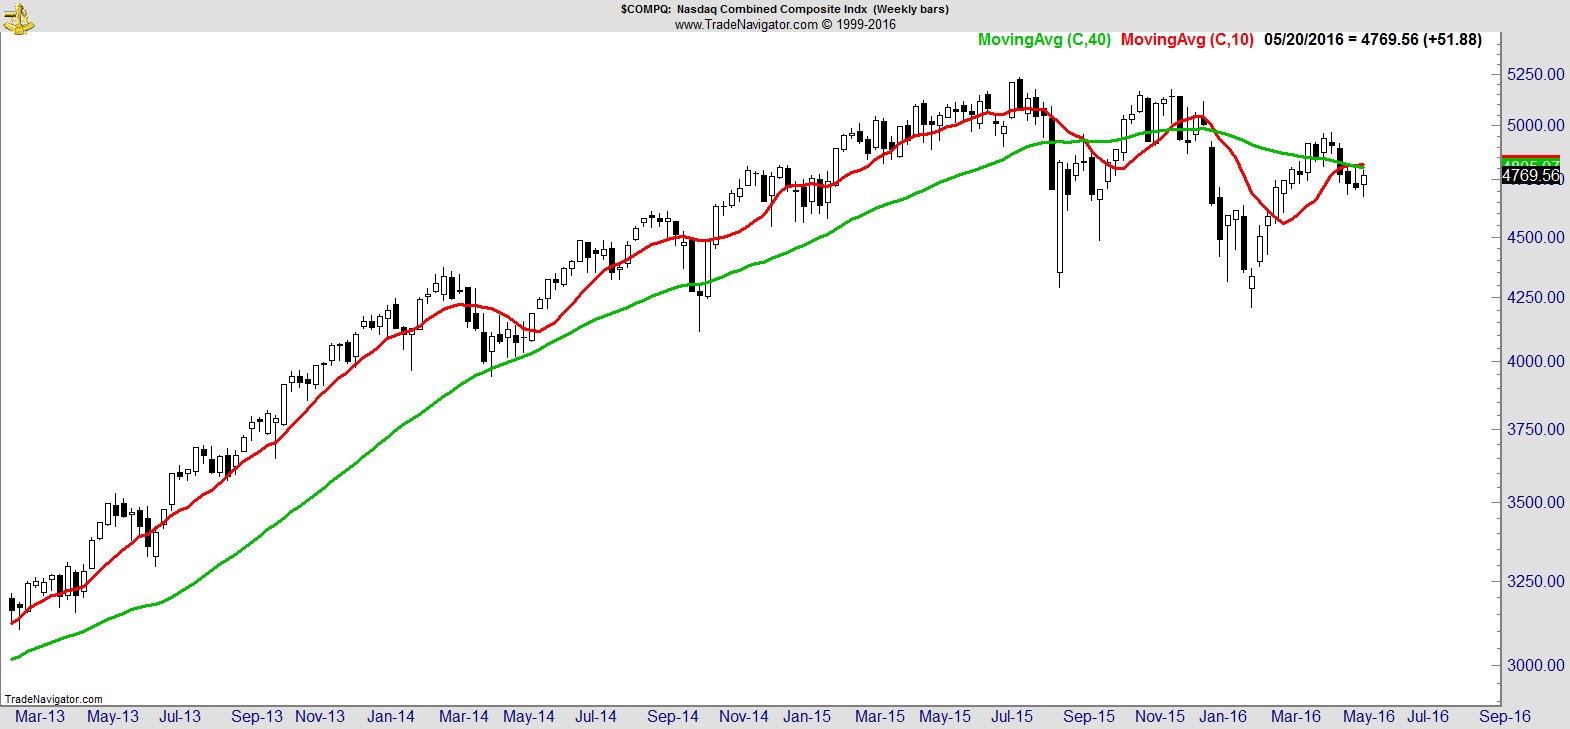
The NASDAQ has clear lower lows and lower highs in place on the weekly. It finished higher to recover the level of 3 weeks ago, and sits just below its 10 and 40-wk MAs.
.
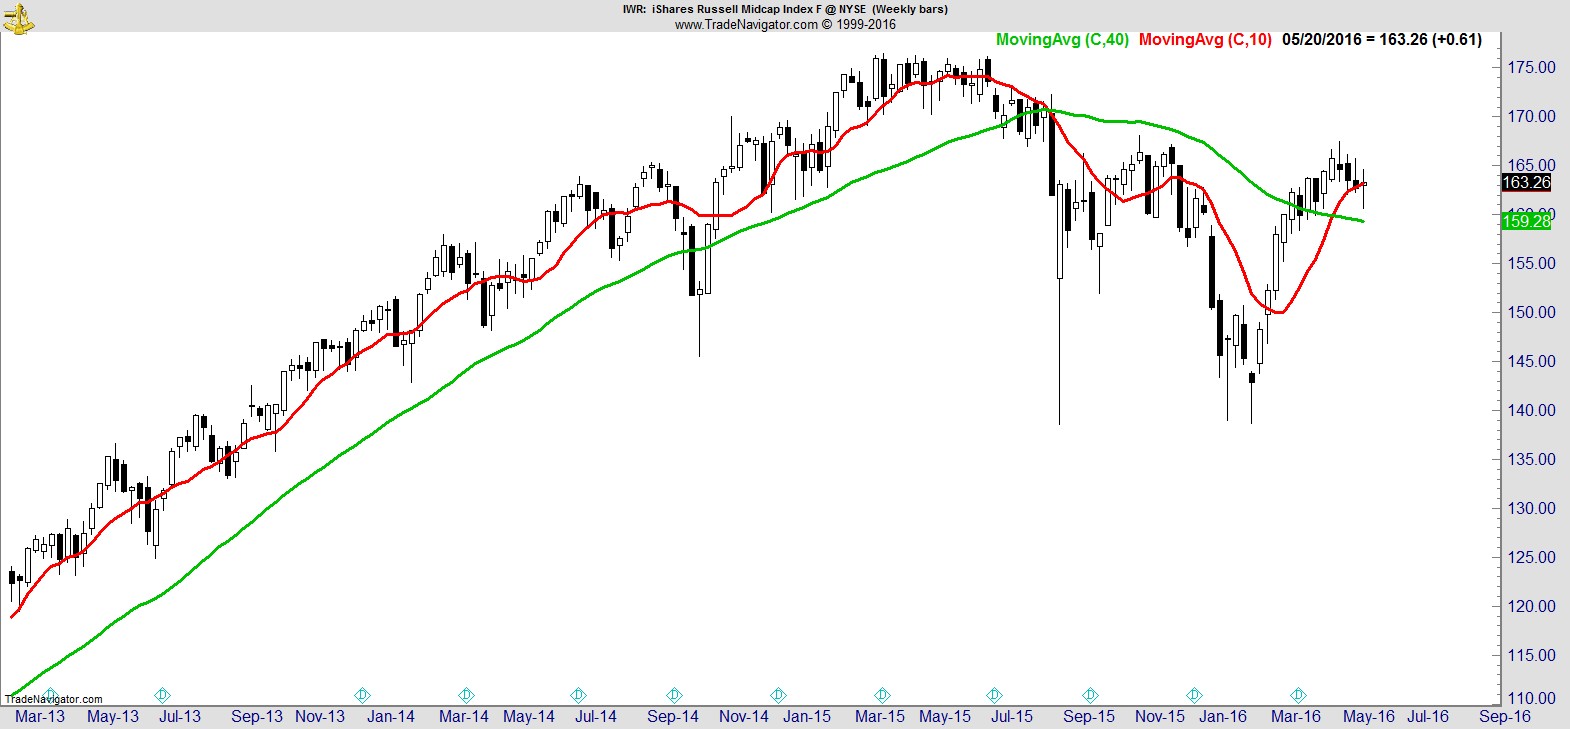
Here's one we don't look at often, the Midcap index ($IWR), which recovered well off its lows to finish above its 10-wk MA. Again for context, it's down just 1.5% in 4 weeks, having previously surged 16.0% in 10 weeks.
.
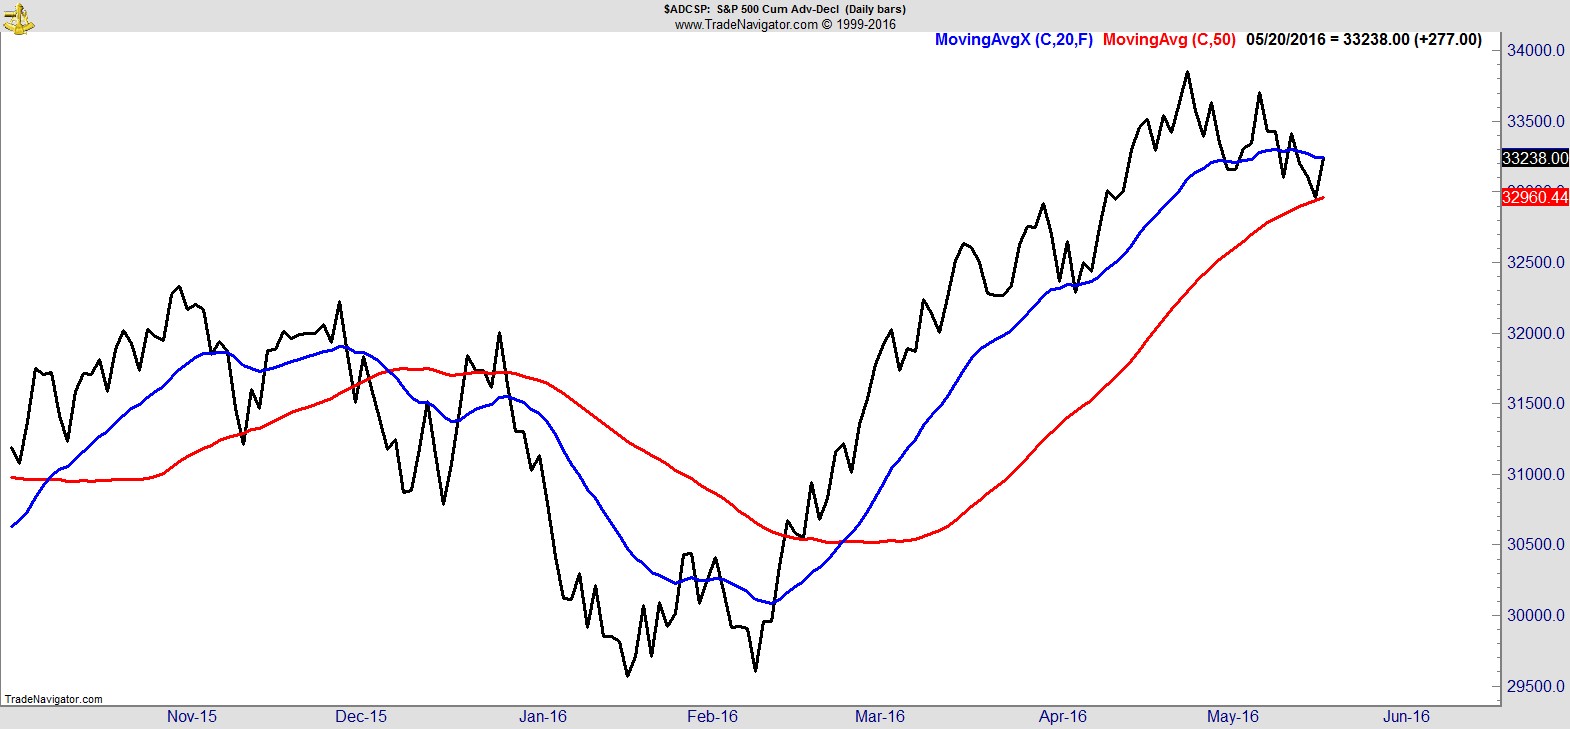
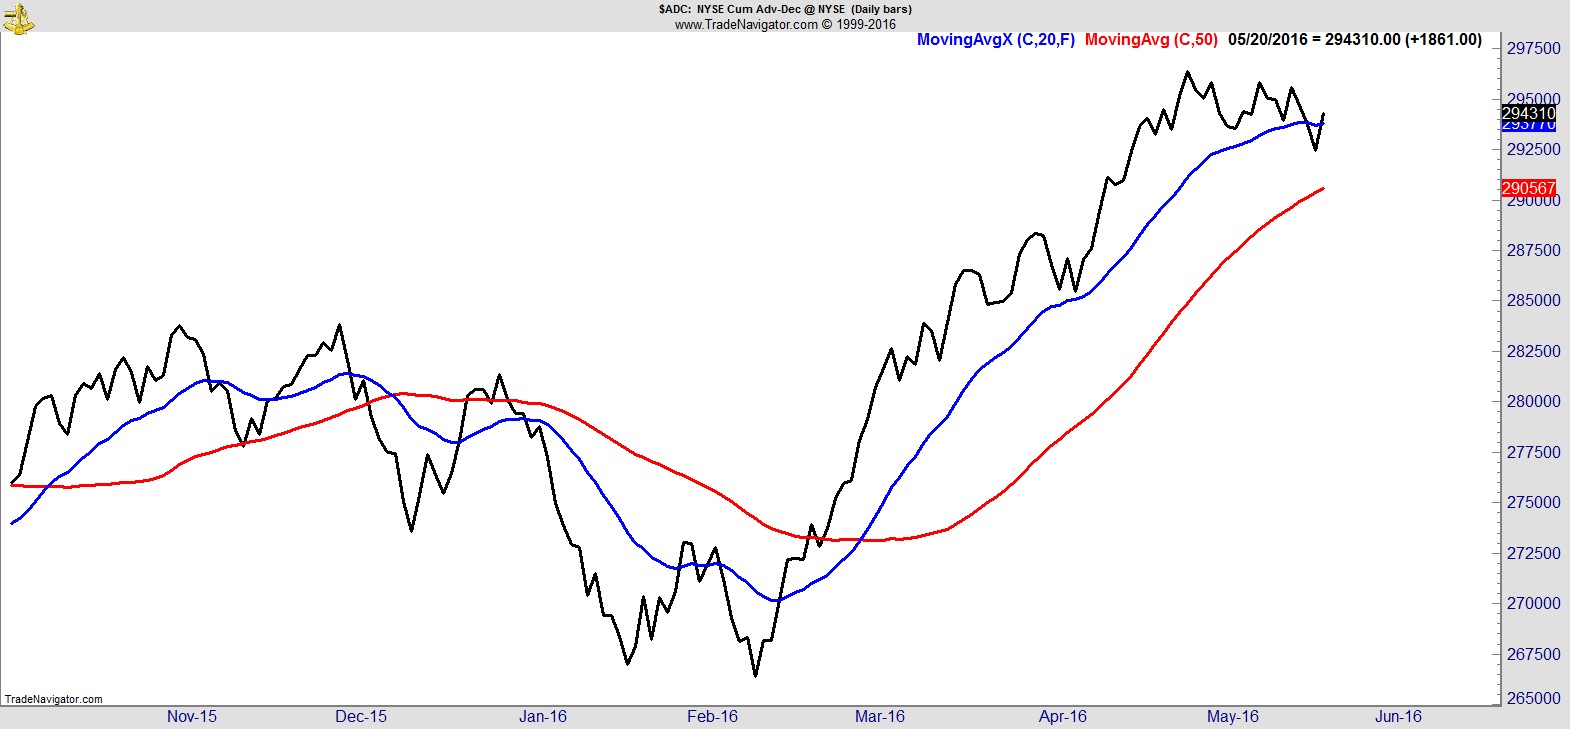
Market breadth has pulled back slightly with price, and much like price it looks like a relatively modest consolidation within an intermediate uptrend. Here's the cumulative advance/decline for the S&P and NYSE:-
.
In contrast to the relatively modest deterioration in breadth and price, sentiment has become markedly bearish.
AAII bulls fell to 19.3% compared to 19.2% at the February lows, near the lowest in 20 years, h/t @RyanDetrick.
The equity-only put/call over the past month reached the equivalent to that near the lows in 2009, 2011, 2012, 2015, and earlier this year, h/t @ukarlewitz.
Blogger sentiment is 59.3% bearish, 25.9% bullish, h/t @Callum_Thomas.
The 4-week average of BAML equity client flows are at 2008 extremes, h/t @MarkNewtonCMT.
2015/16 net outflows from equity funds and equity ETFs are already bigger than 2008/09, h/t @RBAdvisors.
In addition, several high-profile money managers have had their bearish views highly-publicized, and there was a negative note on global equities from Goldman recommending cash. Forgive me for being cynical, but that is such a convenient self-serving call if ever there was one; play on the fear of the Fed and an election year, take the commission on selling everything, and then a few weeks or months later (you know they will) recommend clients buy back in. Whether the call pays off or not for the client, it sure pays off for the broker. Thanks for playing.
.
Sector Analysis
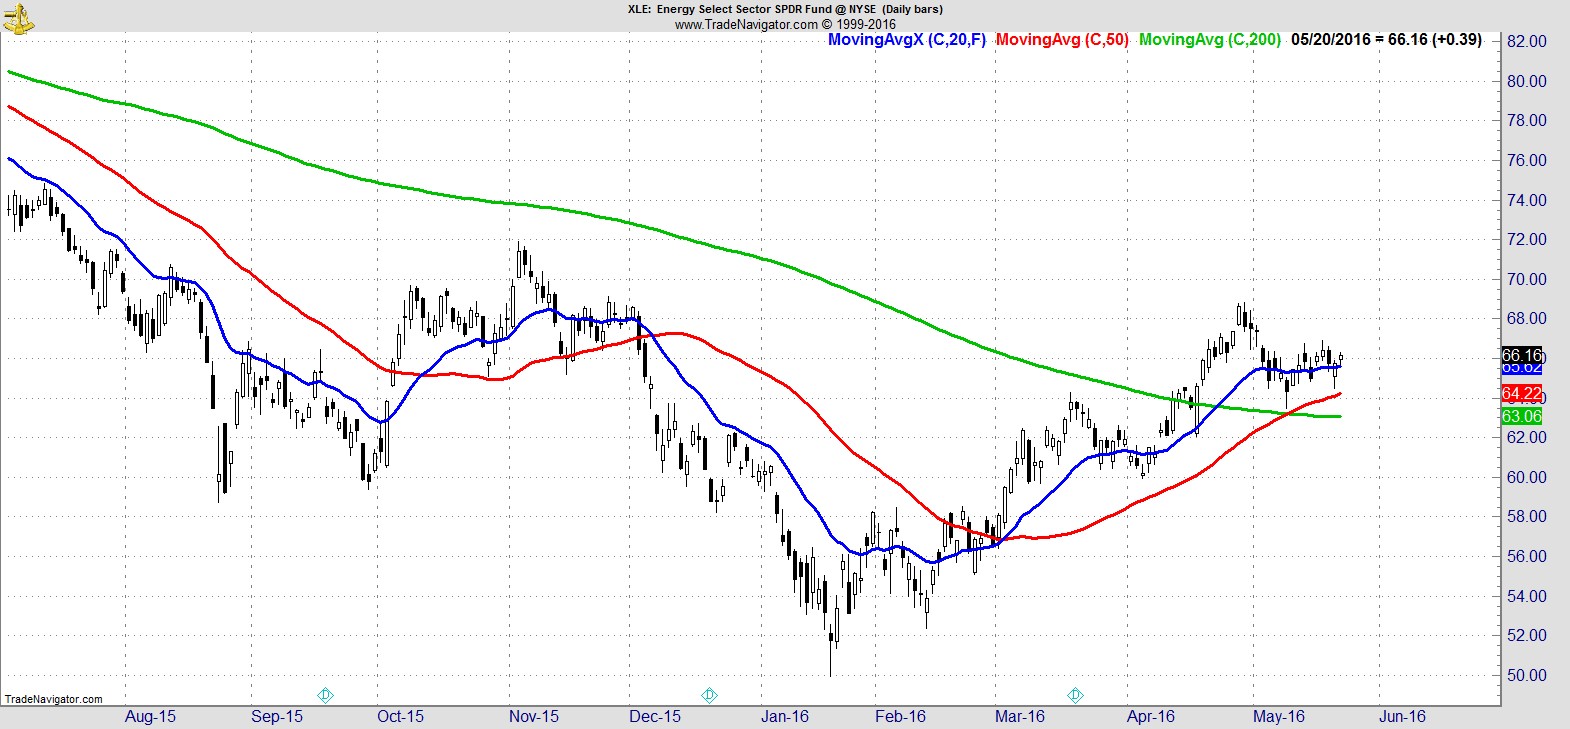
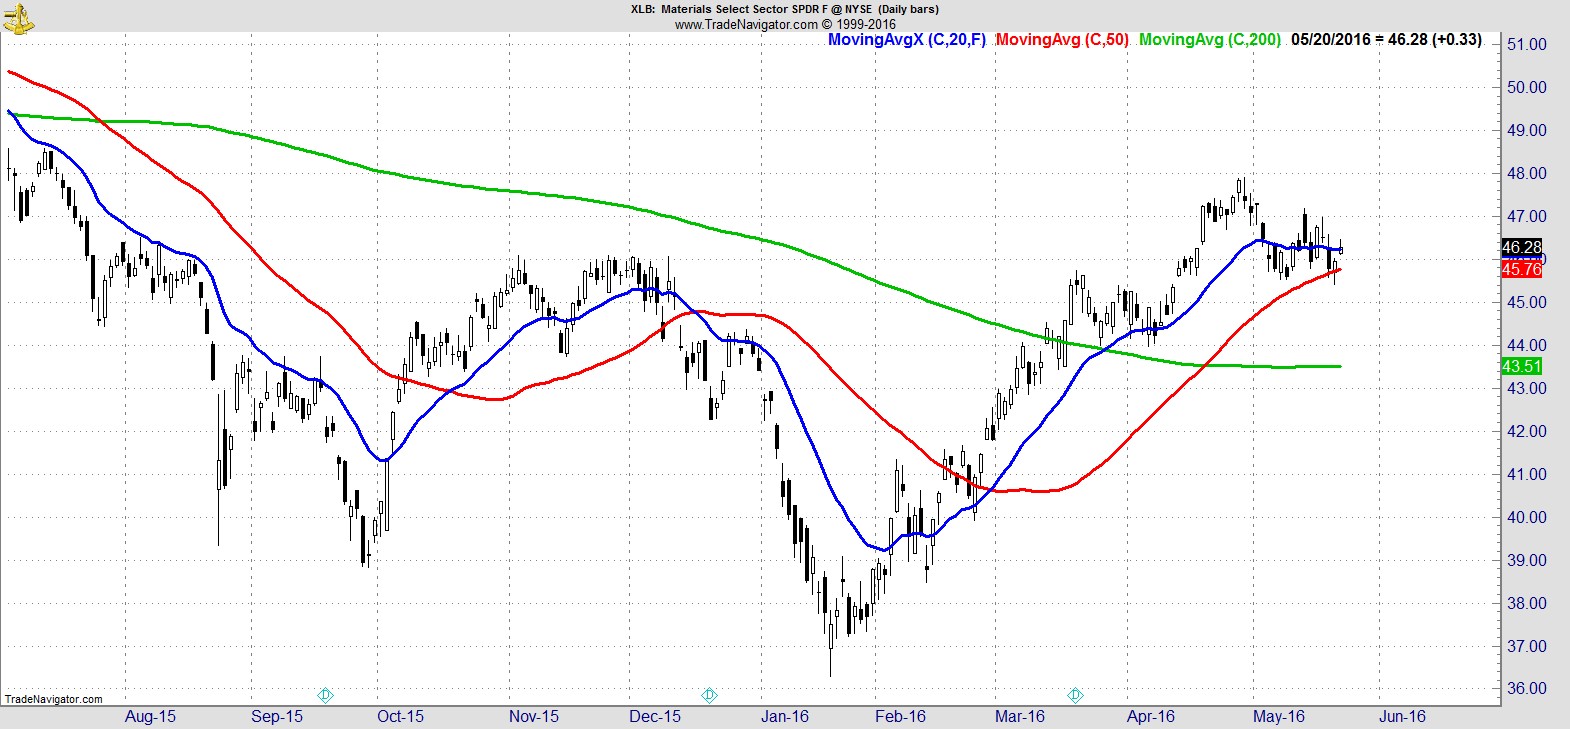
There were some sharp twists and turns in the day-to-day action in individual sectors, but now the dust has settled, all nine S&P Sector SPDRs are above their 200-day MA, something I venture you would find hard to believe if you had listened to any market commentary this week.
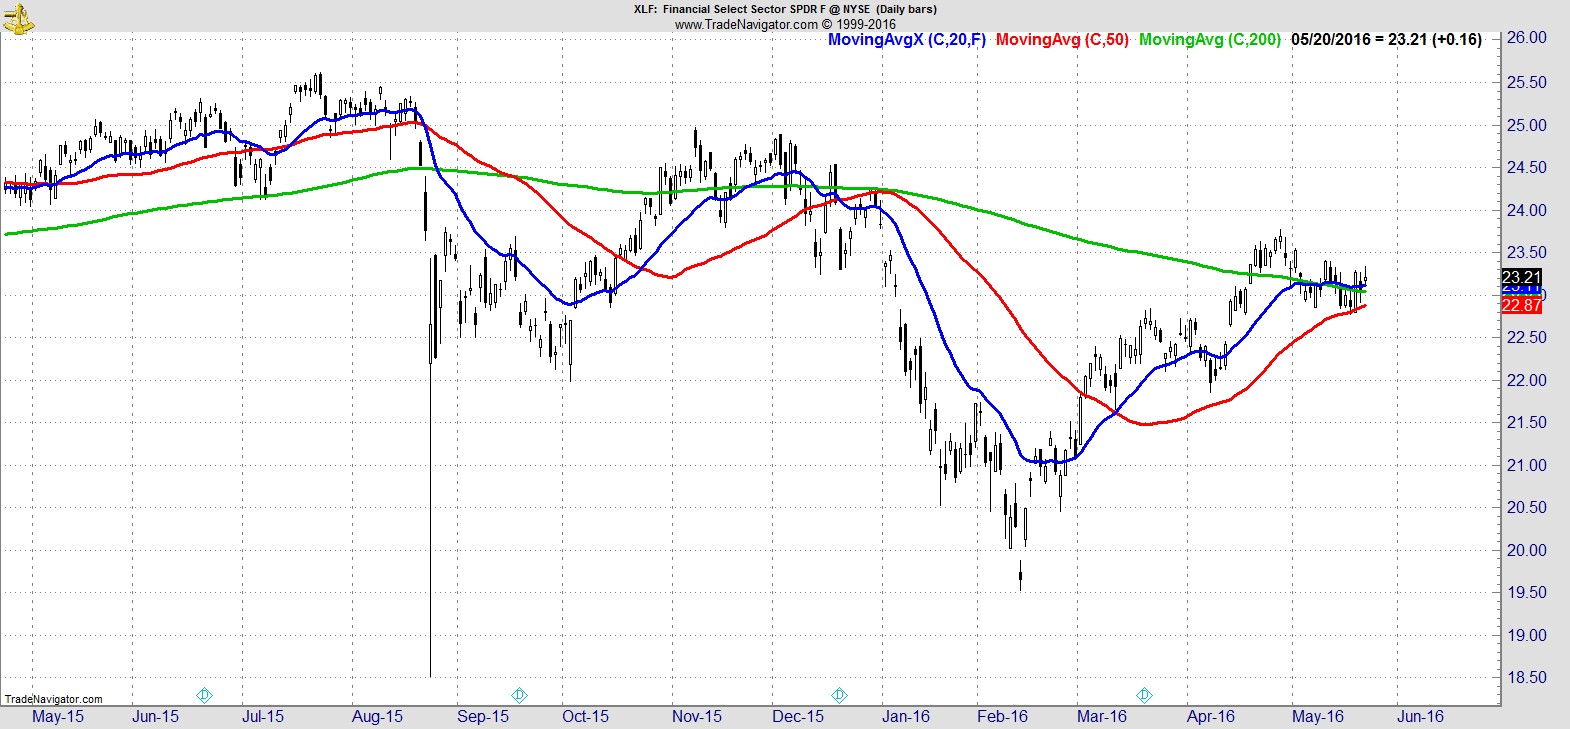
Energy ($XLE) and Materials ($XLB) are above their 20, 50, 200-day MAs which in turn are stacked (20 above the 50, 50 above the 200) and rising. Financials ($XLF) is also starting to look interesting, recovering ground above its MAs this week and potentially leaving in place another higher low.
.
Former leaders Utilities ($XLU), Staples ($XLP), Industrials ($XLI), and also Consumer Discretionary ($XLY) are all below their 20 and 50-day MAs, but above their 200-day.
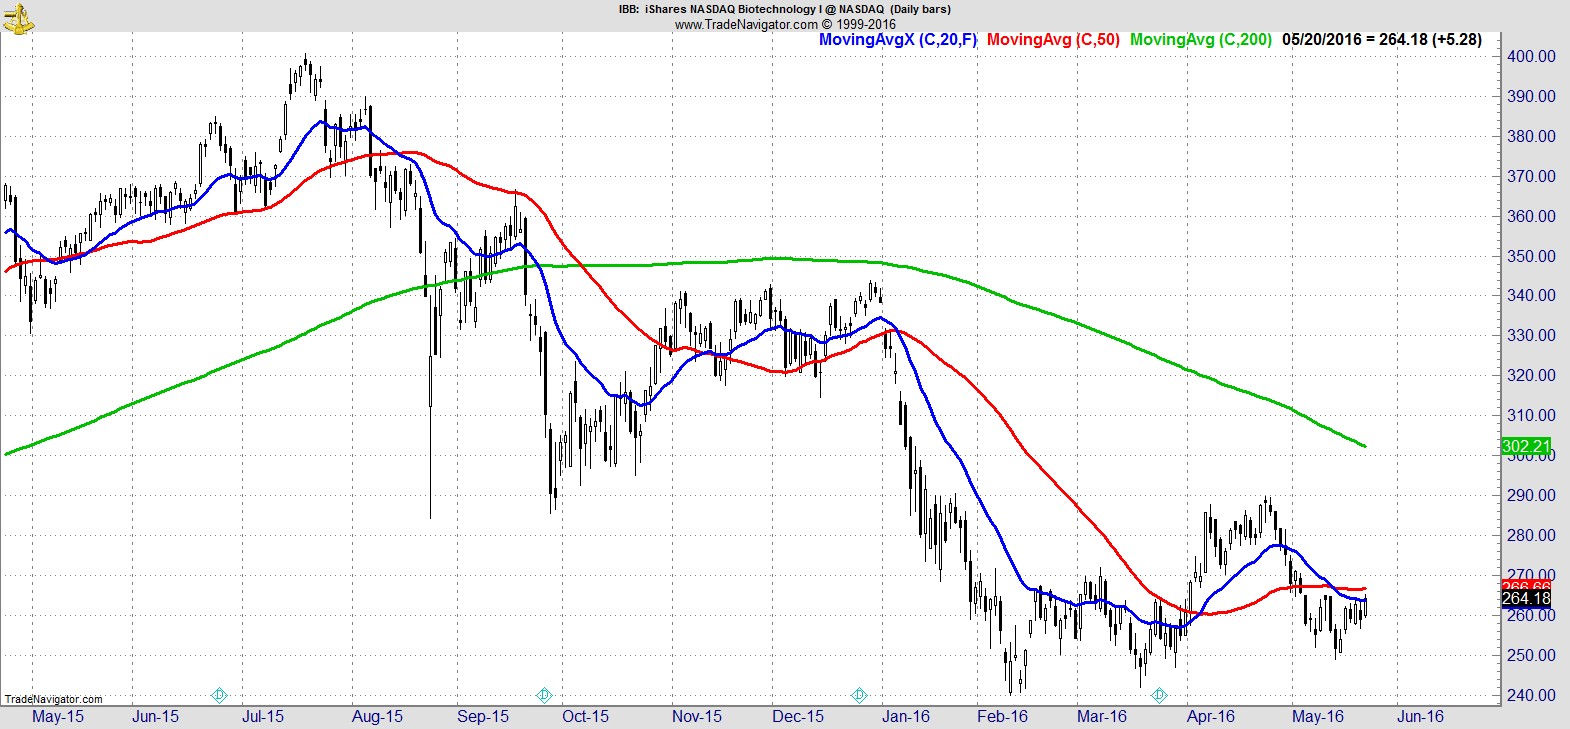
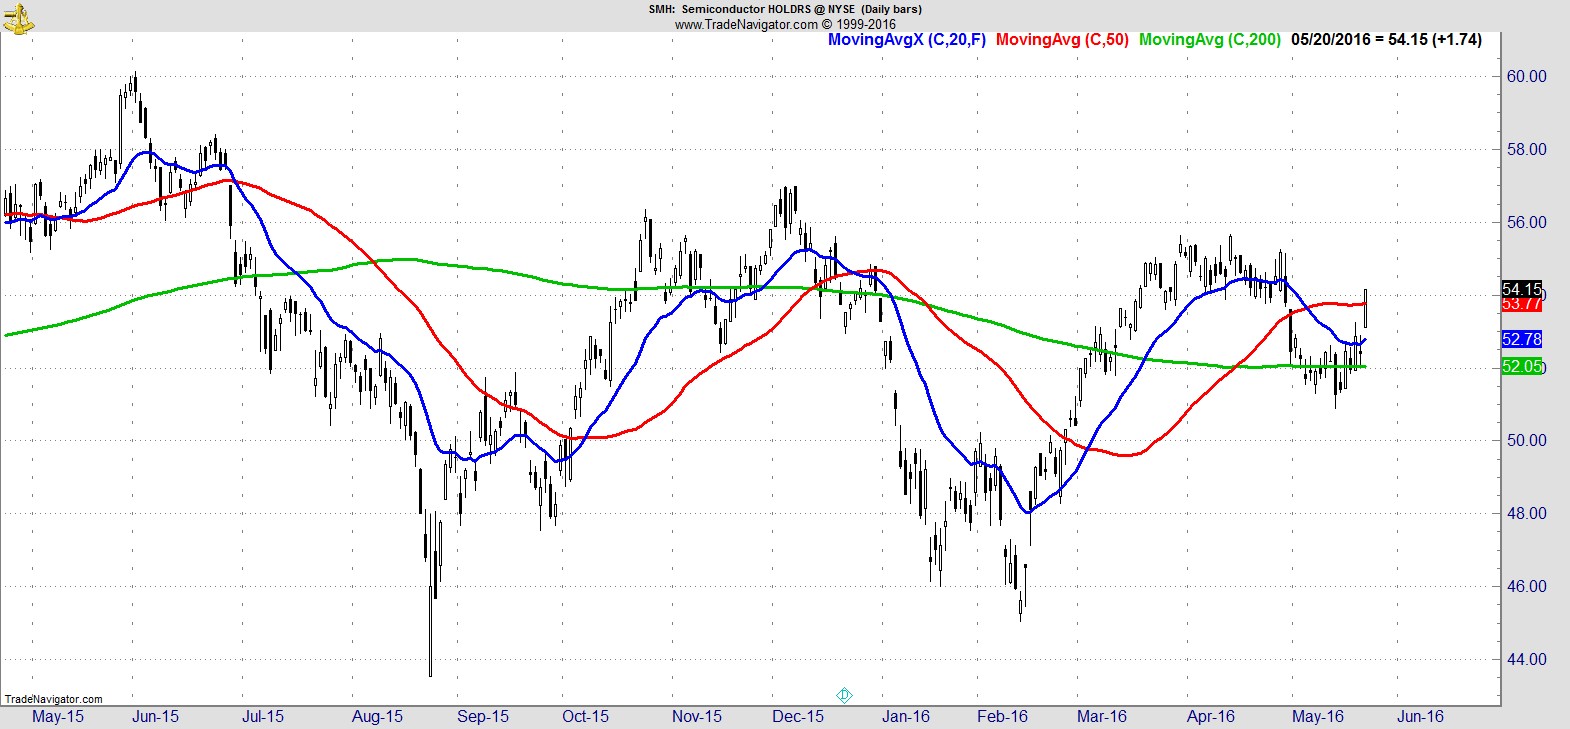
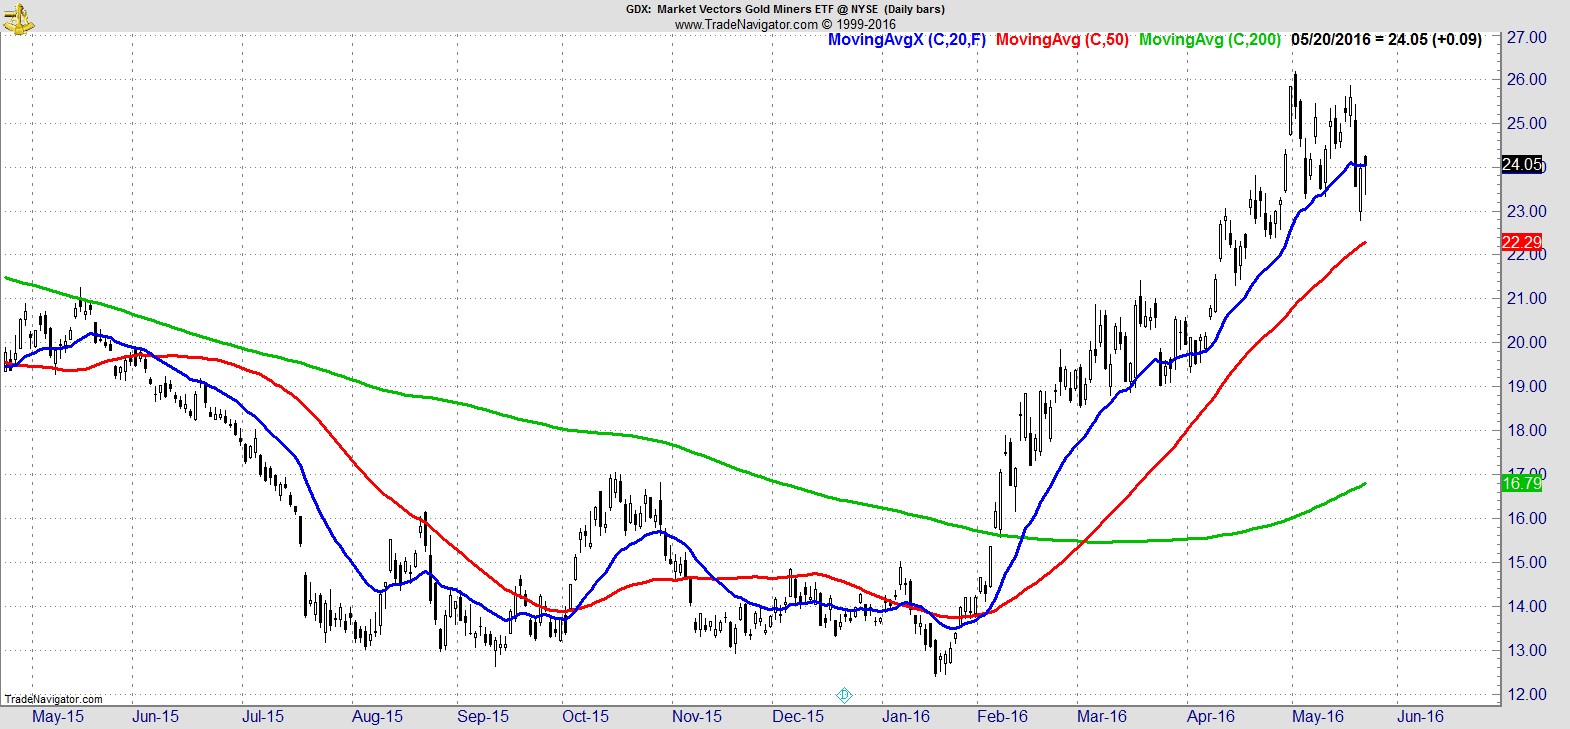
Elsewhere, Biotech ($IBB) recovered to test the underside of its MAs, and Semis ($SMH) rebounded to the highest close in 3 weeks. Gold Miners endured another volatile week but remain in a strong intermediate uptrend.
.
Alpha Capture Portfolio
Our portfolio dipped -0.4% this week vs +0.1% for the S&P.
It's now -3.0% YTD vs +0.4% for the S&P.
We had one exit, our first exit in three weeks, to leave us with 13 positions, total open risk of 5.6%, and around 7% cash.
SUBSCRIBE FOR NEW PORTFOLIO SIGNALS, ADDITIONAL TRADE IDEAS, AND A COMPLETE WATCHLIST.
.
Watchlist
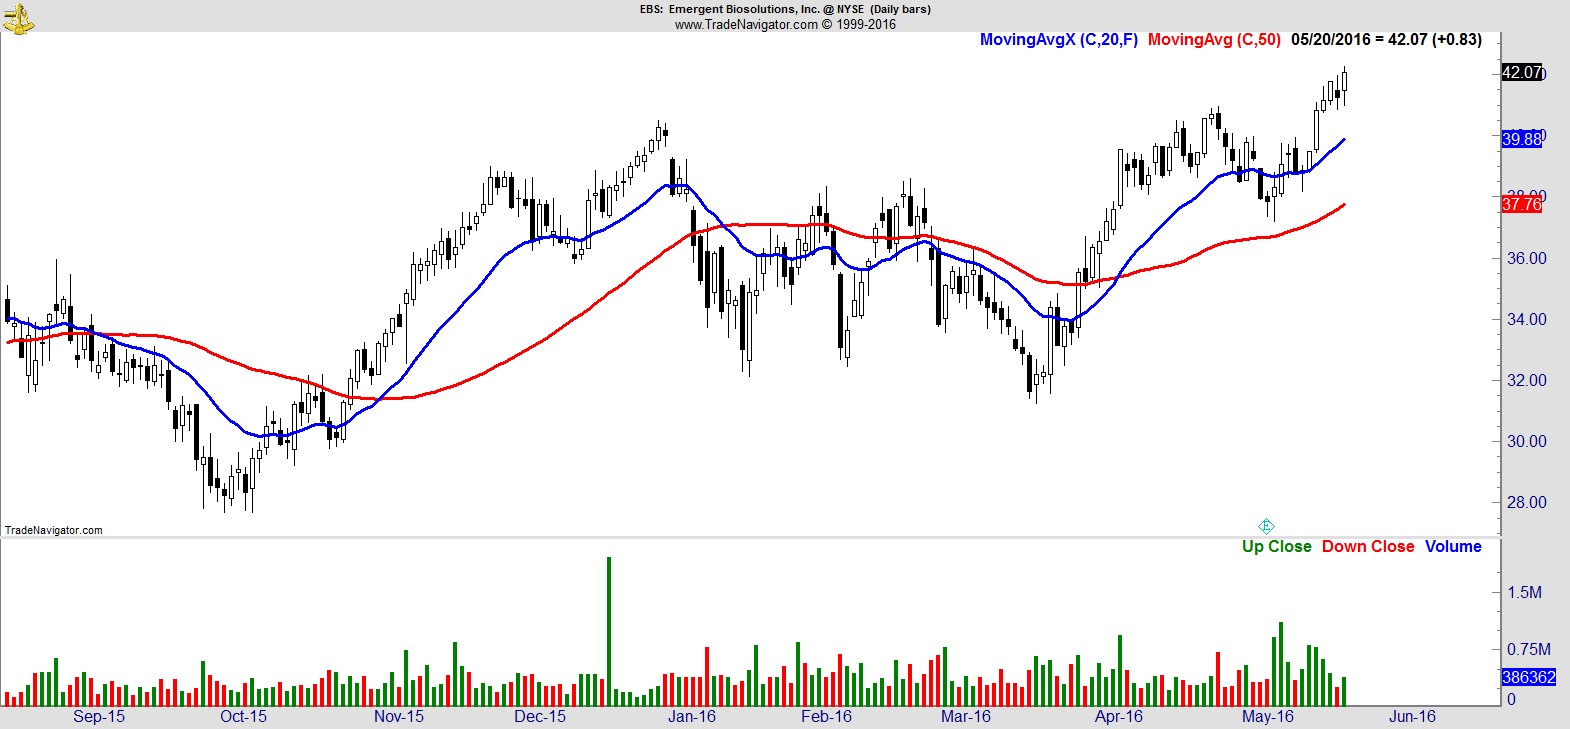
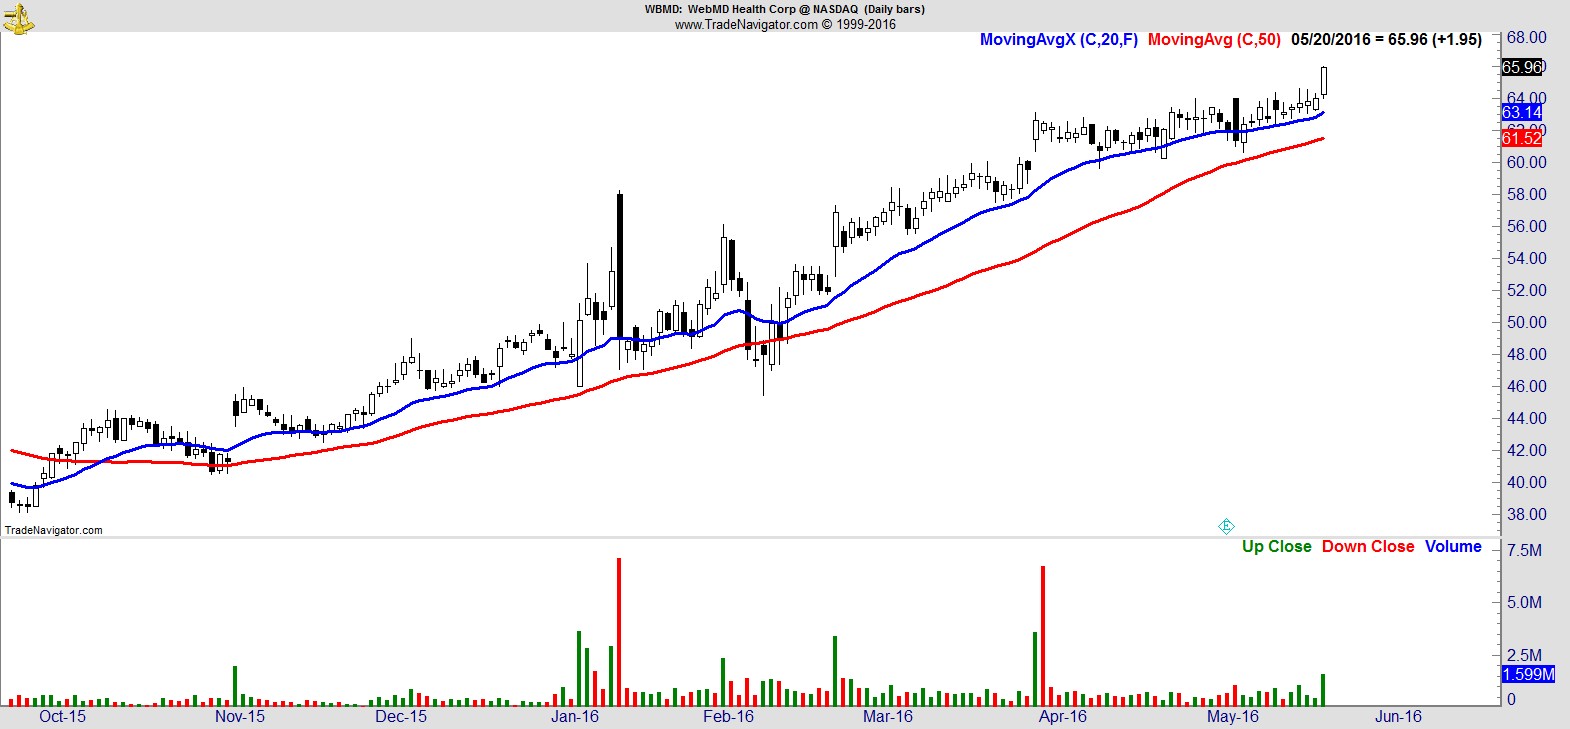
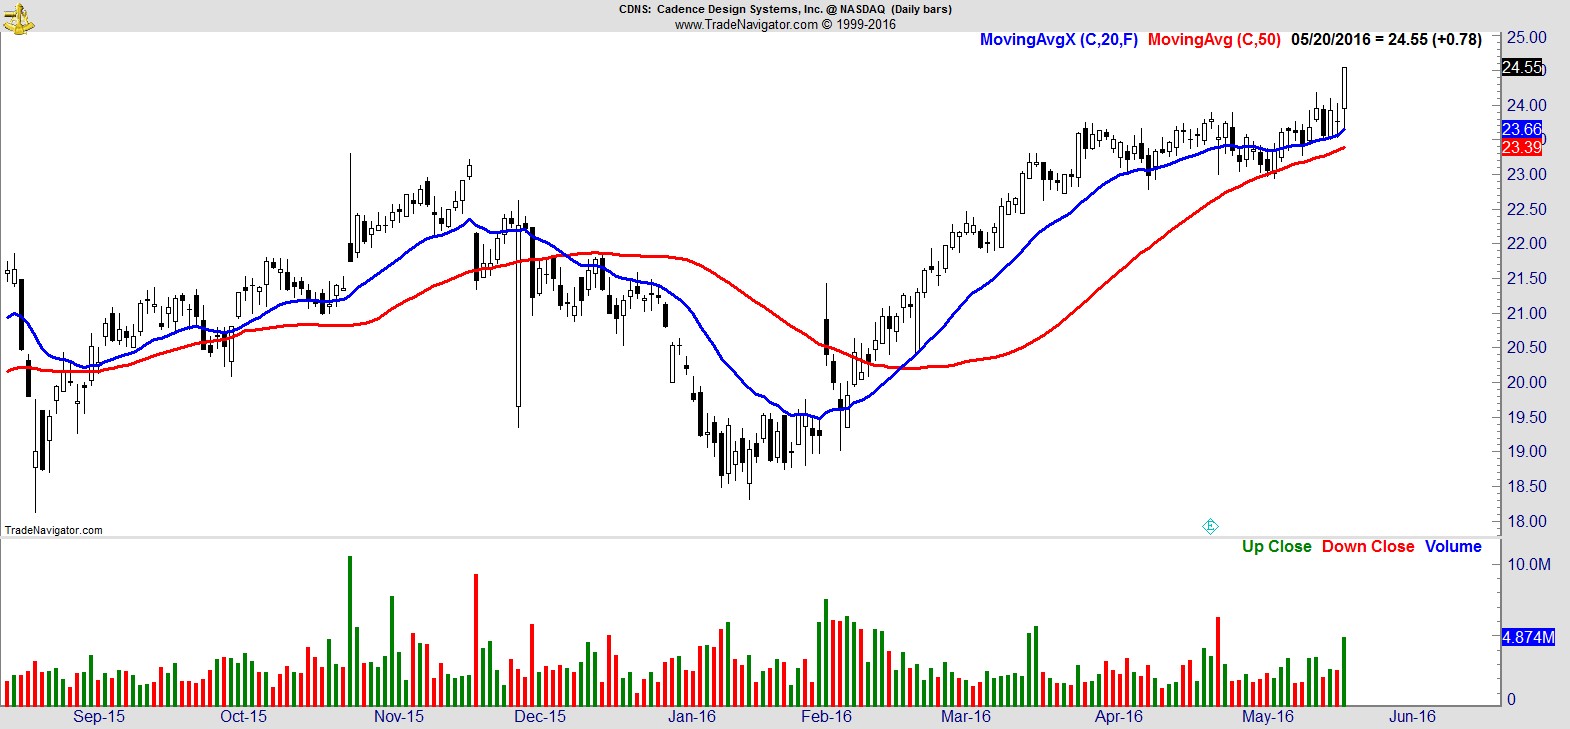
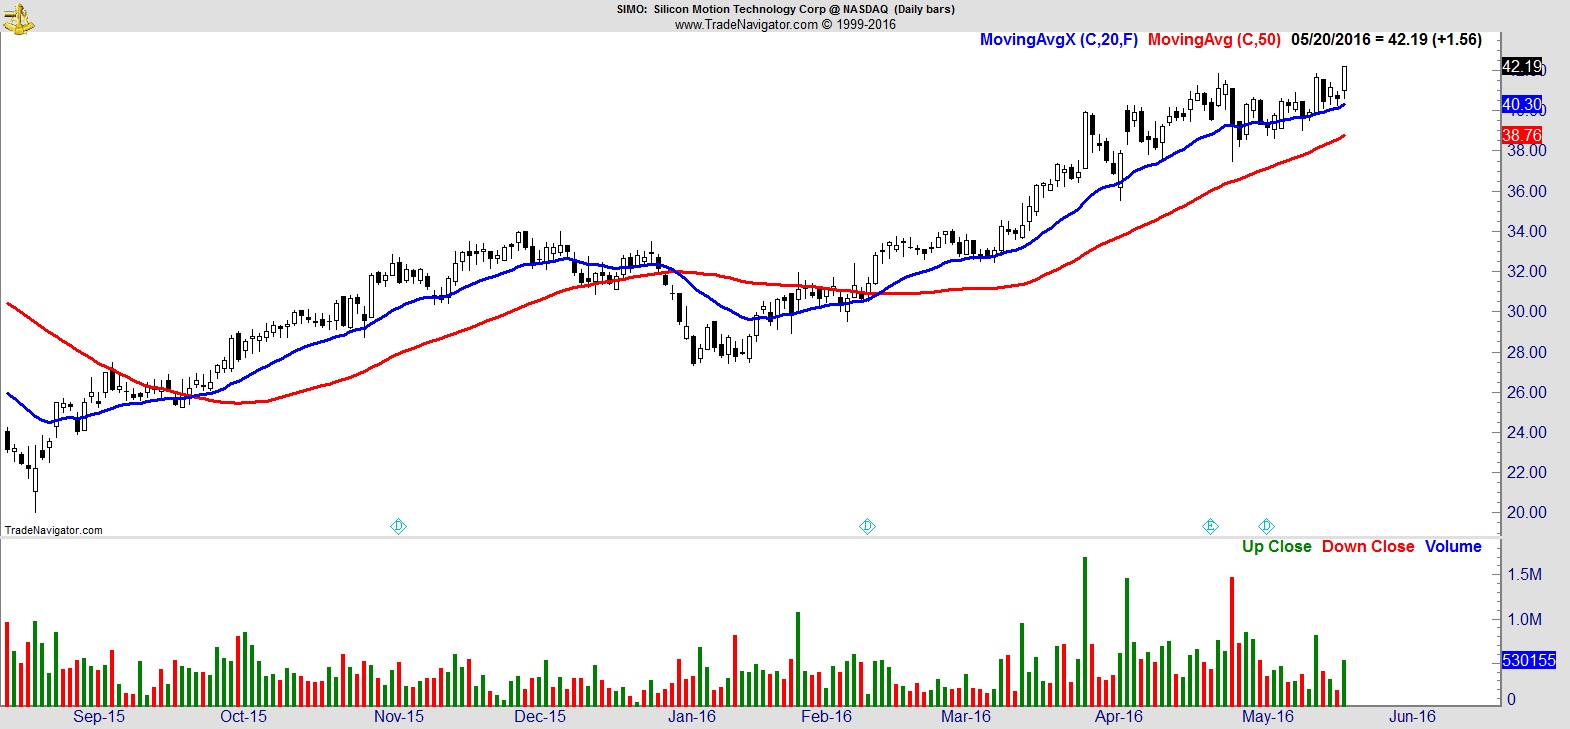
There's a fair mix of industrial and energy/materials names again this week, but the biggest change is in the number of healthcare and technology names starting to show through as both sectors recover from their respective lows.
Here's a sample of 8 from the full list of 30 names:-
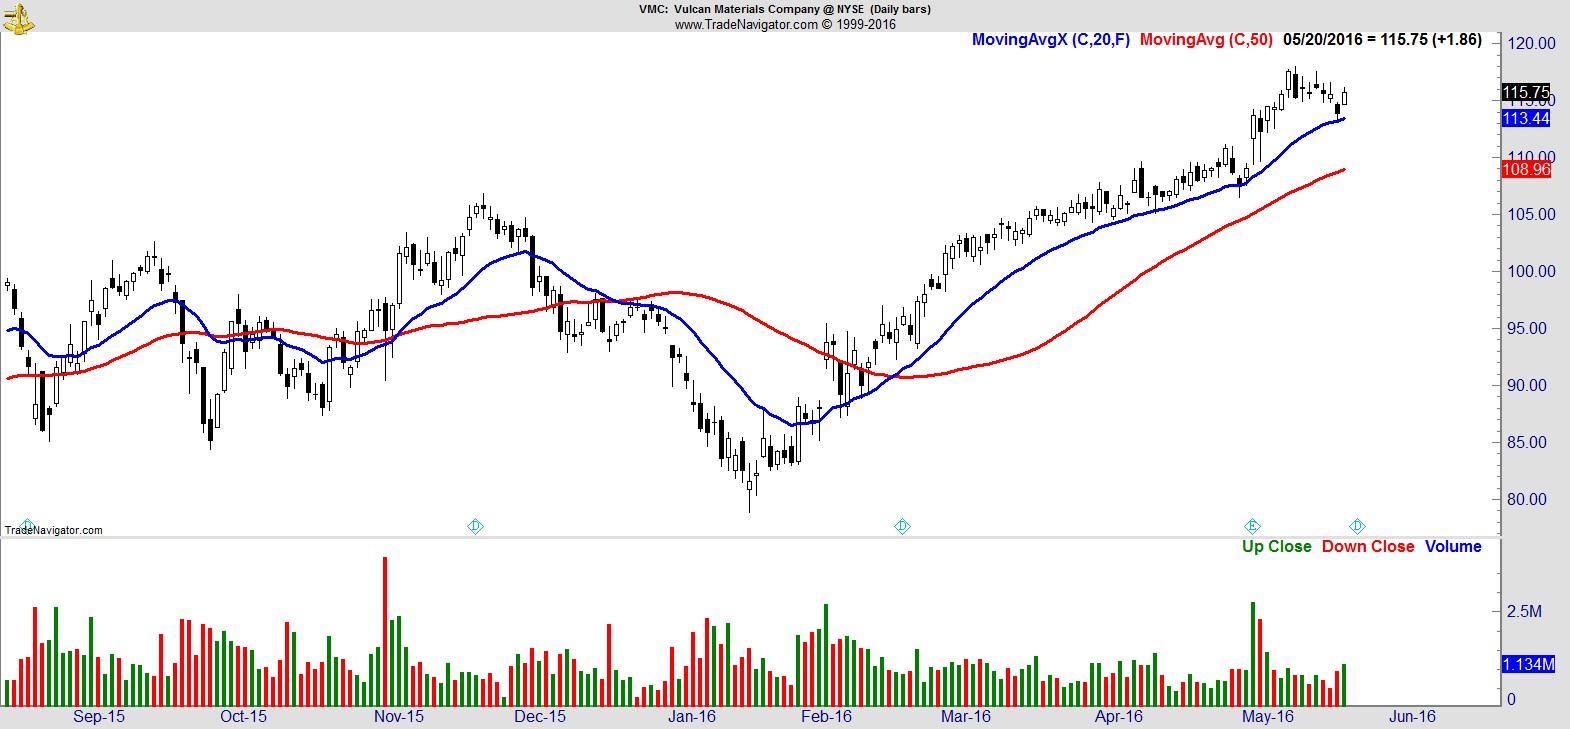
$VMC
.
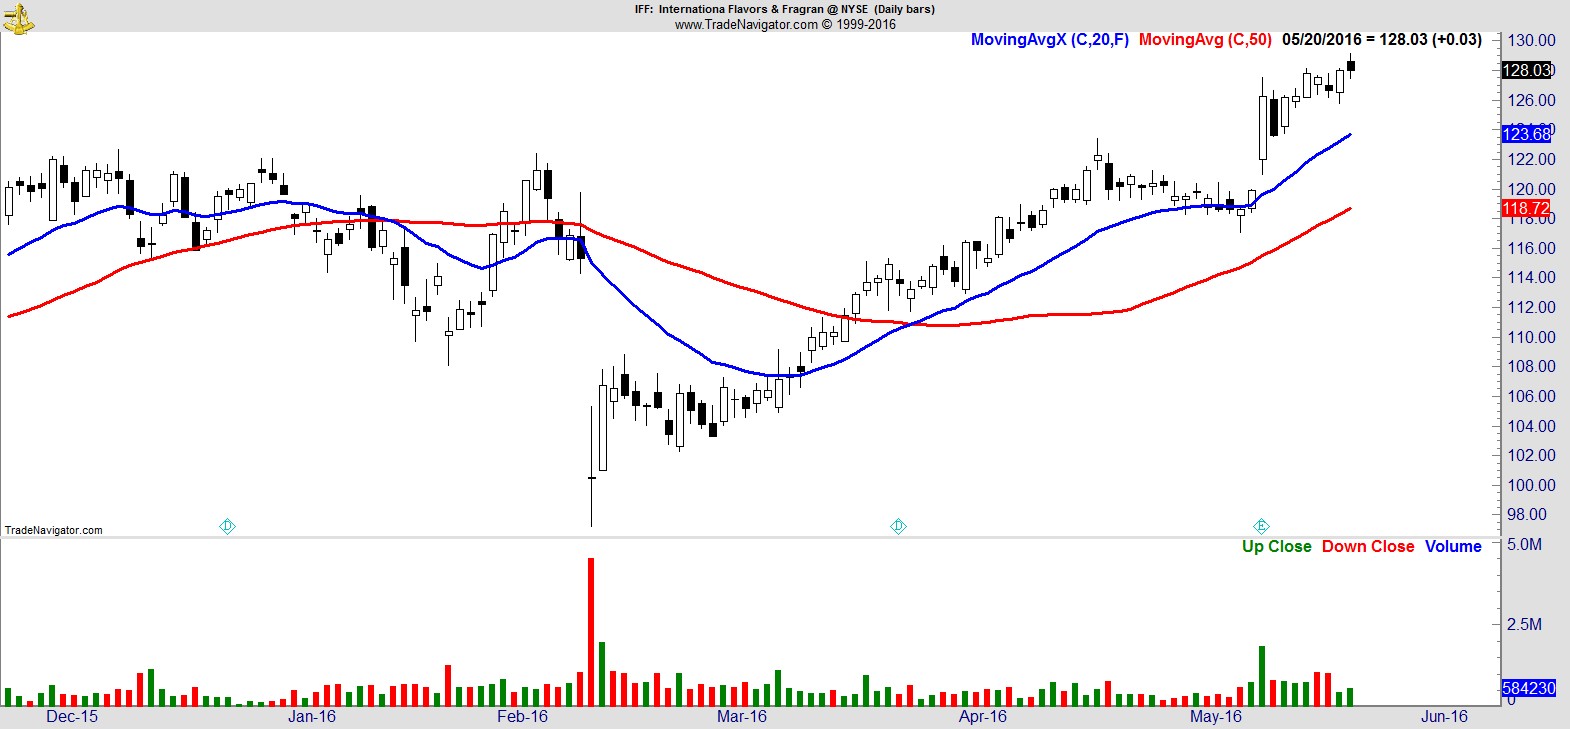
$IFF
.
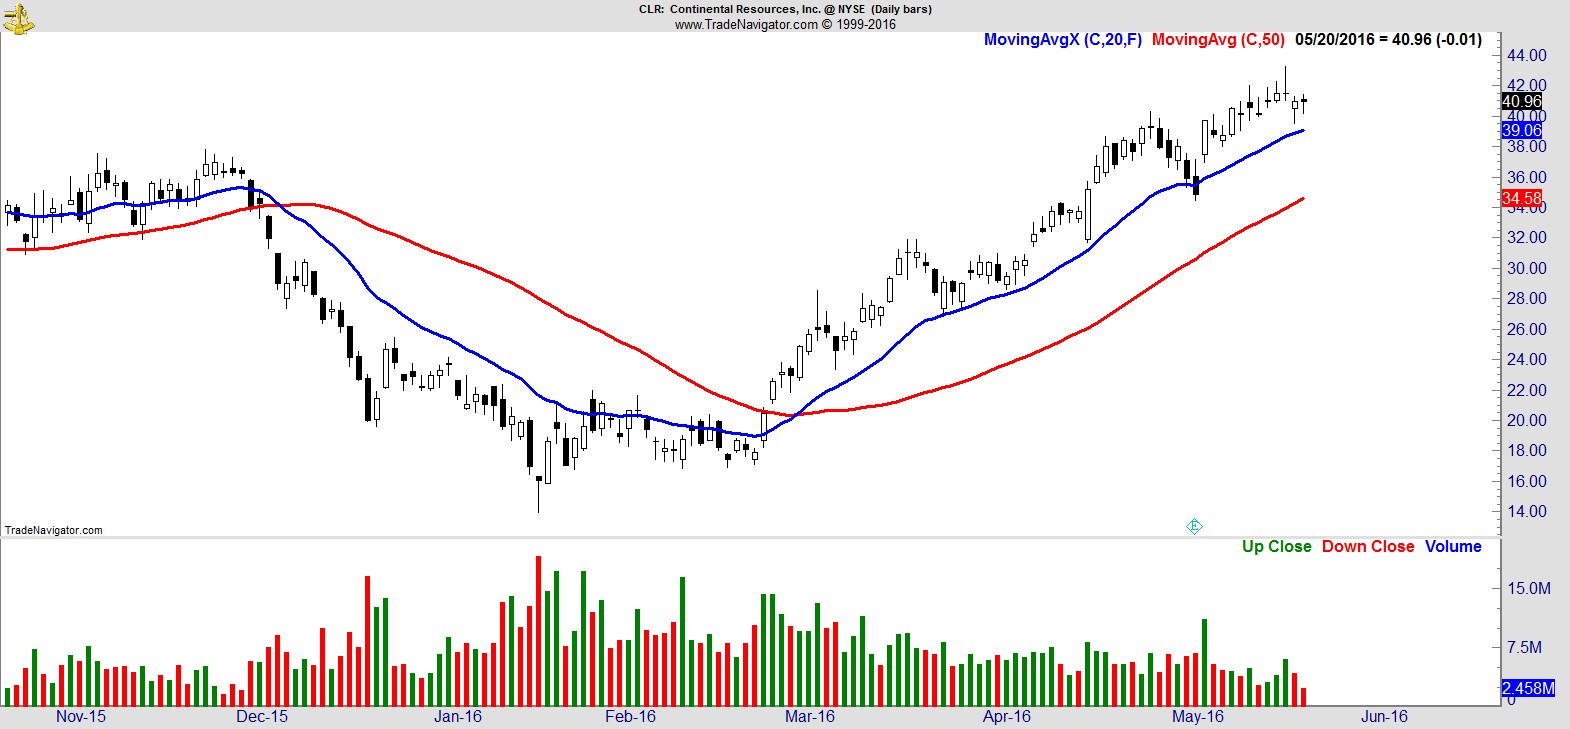
$CLR
.
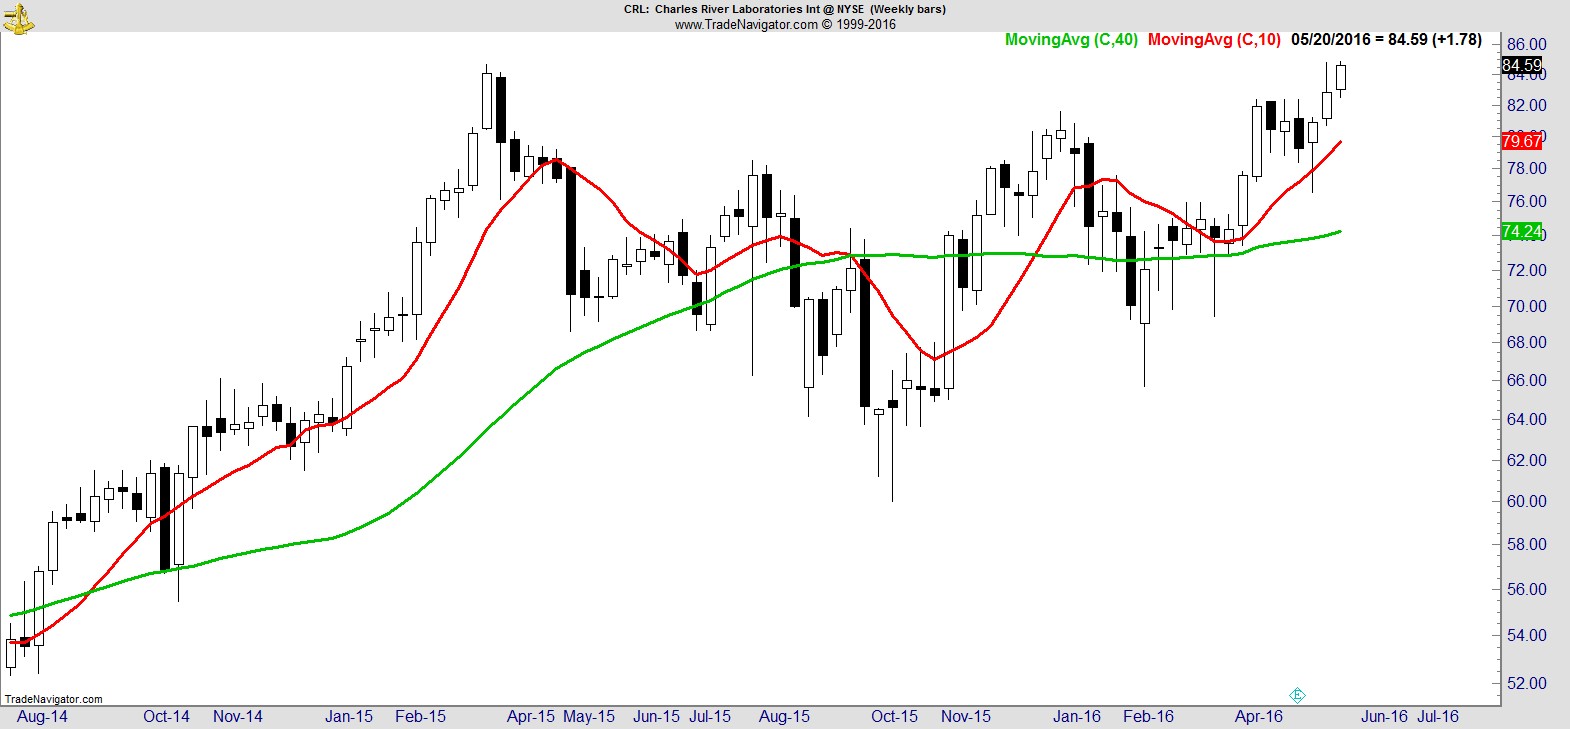
$CRL
.
$EBS
.
$WBMD
.
$CDNS
.
$SIMO
SUBSCRIBE FOR NEW PORTFOLIO SIGNALS, ADDITIONAL TRADE IDEAS, AND A COMPLETE WATCHLIST.
.
Recent free content from Jon Boorman
-
 Weekend Review and Watchlist
— 9/30/17
Weekend Review and Watchlist
— 9/30/17
-
Weekend Review and Watchlist
— 9/22/17
-
Weekend Review and Watchlist
— 9/17/17
-
Weekend Review and Watchlist
— 9/10/17
-
Weekend Review and Watchlist
— 9/02/17