

Has The Summer Rally Begun?
Modern times demand modern thinking in portfolio design. Learn more...
To be sure, there is a great deal of confusion/uncertainty in the stock market these days. One minute everything is negative and all the bear arguments make sense. And the next, well, stocks are blasting higher. Such is the way the game is played in what I call the algorithmic trading era where central bankers are the primary players and computers run the game.
So, in an effort to try and cut through the noise and identify what is actually happening in the market, I'll offer up my "executive summary" of the market which is split up by time frame. It is my sincere hope that you might be able to find a nugget or two in the following assessment of market conditions/drivers.
MICRO-TERM (0-5 Days)
From a micro-term perspective, it is important to note that yesterday's joyride to the upside was sponsored by (a) a BIG surprise in New Home Sales and (b) a resurgence in tech (where the semis let the way). The housing data point came in at the fastest pace in 8 years and confirms the thinking that the economy may not be in the dumps after all. The report caused traders to assume the Fed is now more likely to raise rates sooner rather than later, which is a good thing for the banks. So, with both technology and the banks displaying some giddyup, the shorts ran for cover, the millisecond-based trend following algos chased their tails all day, and those looking for a summer rally jumped in. And for the record, the combination of leadership from banks and technology tends to be, oh, that's right, bullish!
The real question for the very near-term will be if the bulls can find a way to keep their newly discovered mojo going in the right direction.
SHORT-TERM (1-30 Days)
Although prices are modestly higher than they were two weeks ago, not much has really changed from a near-term perspective in the U.S. stock market. The good news is that the bears have been unable to take advantage of the calendar-based tailwind (i.e. the "Sell in May and go away" trade) and all the uncertainty surrounding the Fed, the economy, earnings, the election, etc. For example, from the April 20 high to the May 19 low, the pullback on S&P 500 has been just 2.97%. Not bad, considering all the negativity that has built up out there. In the near-term, the focus has now shifted to the Fed and the U.S. dollar. Prior to the release of the minutes from the most recent FOMC meeting, the odds (as defined by activity in the options and futures markets) of a Fed hiking rates in June were around 10%. However, given the contents of the minutes and the recent "Fedspeak" talking up the potential for 2 – 3 more rate increases this year, the odds of a hike in June have now moved to about 60%. The economists I follow now expect the next 25 basis point increase in the Fed Funds rate to occur by the July meeting at the latest.
S&P 500 - Daily 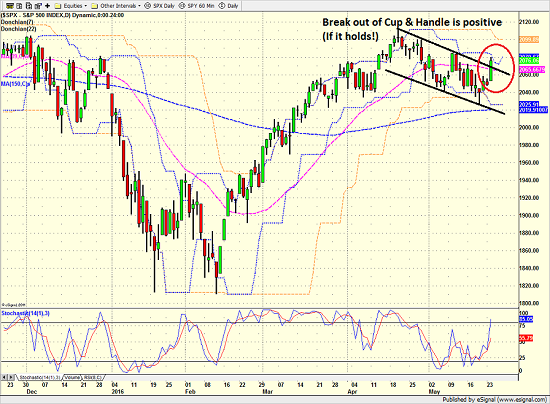
View Larger Image
INTERMEDIATE-TERM (2-6 months)
From an intermediate-term point of view, almost no one on the street is looking for stocks to produce any kind of meaningful returns any time soon. Goldman Sachs was the latest firm to recently suggest investors need to curb their enthusiasm in terms of expected gains in the stock market. So, the first point here is that being optimistic about the market is the true contrarian view at this time. Uncertainty gets most of the blame from the bear perspective with rates, the state of the global economy and the election in the spotlight. Yet at the same time, our furry friends have been unable to break through important support at 2020 (where the 150-day ma currently resides). The good news is that the cycle composite is calling for a steady rally, with only modest interruptions, from now through the middle of August. From my seat, a meaningful move above 2100 would suggest that the summer rally is underway.
S&P 500 - Weekly 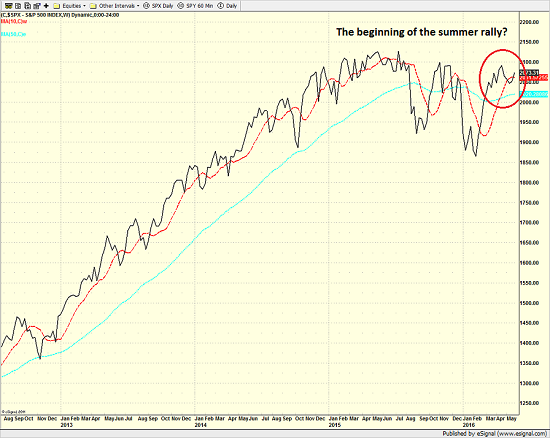
View Larger Image
LONG-TERM (>6 months)
From a longer-term perspective, there is actually some good news to report. First, one of the key components of our economic model has upticked into the "strong growth" mode. While this may cause a lot of eyebrows to be raised and perhaps even some skeptical head-shaking in response, my takeaway from the model improvement is that the U.S. economy is not in the dire condition being espoused by the bears. In fact, the evidence shows that the economy is actually improving. Going hand in hand with an improving economy is an uptick (albeit modest) being seen in our inflation models. In short, the inflation outlook is now neutral – meaning there is "some" inflation percolating in the pipeline. This also suggests that the recent move up in rates is indeed warranted. The question, of course, is if the improvement in the economy, inflation, and the level of rates will be sustainable. After all, the economy has been wrestling with "escape velocity" for many years now. And from a long-term point of view, this appears to be the key to proving the bear camp wrong.
We continue to advise leaning bullish and buying the dips.
Current Market Drivers
We strive to identify the driving forces behind the market action on a daily basis. The thinking is that if we can both identify and understand why stocks are doing what they are doing on a short-term basis; we are not likely to be surprised/blind-sided by a big move. Listed below are what we believe to be the driving forces of the current market (Listed in order of importance).
1. The State of Global Growth
2. The State of Interest Rates
3. The State of Global Central Bank Policy
4. The State of the Stock Market Valuations
Today's Pre-Game Indicators
Here are the Pre-Market indicators we review each morning before the opening bell...
Major Foreign Markets:
Japan: +1.57%
Hong Kong: +2.71%
Shanghai: -0.23%
London: +0.60%
Germany: +1.23%
France: +0.91%
Italy: +0.96%
Spain: +1.78%
Crude Oil Futures: +$0.55 to $49.17
Gold: -8.10 at $1224.10
Dollar: lower against the yen and pound, higher vs. euro
US 10-Year Bond Yield: Currently trading at 1.862%
German 10-Year Bund Yield: Currently trading at 0.168%
Stock Indices in U.S. (relative to fair value):
S&P 500: +9.69
Dow Jones Industrial Average: +70
NASDAQ Composite: +23.10
Thought For The Day:
"My biggest drawdowns have always come after I have had a great period and I started to think that I knew something" -Paul Tudor Jones
Here's wishing you green screens and all the best for a great day,

David D. Moenning
Founder: Heritage Capital Research
Chief Investment Officer: Sowell Management Services
Looking for More on the State of the Markets?
!function(d,s,id){var js,fjs=d.getElementsByTagName(s)[0],p=/^http:/.test(d.location)?'http':'https';if(!d.getElementById(id)){js=d.createElement(s);js.id=id;js.src=p+'://platform.twitter.com/widgets.js';fjs.parentNode.insertBefore(js,fjs);}}(document, 'script', 'twitter-wjs');Disclosures
The opinions and forecasts expressed herein are those of Mr. David Moenning and may not actually come to pass. Mr. Moenning's opinions and viewpoints regarding the future of the markets should not be construed as recommendations. The analysis and information in this report is for informational purposes only. No part of the material presented in this report is intended as an investment recommendation or investment advice. Neither the information nor any opinion expressed constitutes a solicitation to purchase or sell securities or any investment program.
Any investment decisions must in all cases be made by the reader or by his or her investment adviser. Do NOT ever purchase any security without doing sufficient research. There is no guarantee that the investment objectives outlined will actually come to pass. All opinions expressed herein are subject to change without notice. Neither the editor, employees, nor any of their affiliates shall have any liability for any loss sustained by anyone who has relied on the information provided.
The analysis provided is based on both technical and fundamental research and is provided "as is" without warranty of any kind, either expressed or implied. Although the information contained is derived from sources which are believed to be reliable, they cannot be guaranteed.
David D. Moenning is an investment adviser representative of Sowell Management Services, a registered investment advisor. For a complete description of investment risks, fees and services, review the firm brochure (ADV Part 2) which is available by contacting Sowell. Sowell is not registered as a broker-dealer.
Employees and affiliates of Sowell may at times have positions in the securities referred to and may make purchases or sales of these securities while publications are in circulation. Positions may change at any time.
Investments in equities carry an inherent element of risk including the potential for significant loss of principal. Past performance is not an indication of future results.
Advisory services are offered through Sowell Management Services.
Recent free content from FrontRange Trading Co.
-
 Is The Bull Argument Too Easy These Days?
— 8/31/20
Is The Bull Argument Too Easy These Days?
— 8/31/20
-
What Do The Cycles Say About 2020?
— 1/21/20
-
Modeling 2020 Expectations (Just For Fun)
— 1/13/20
-
Tips From Real-World Wendy Rhoades
— 5/06/19
-
The Best Recession Ever!
— 4/29/19
-
{[comment.author.username]} {[comment.author.username]} — Marketfy Staff — Maven — Member


- 1 Campus Martius, Suite #200Detroit, MI 48226
- +1 877 440 9464