

Was That A Failed Breakout in Russell2000?
One of my favorite setups across markets are when prices make new highs, momentum does not confirm and then prices fall back below those former highs. Some people like to call these whipsaws, others call them failed breakouts, some call them bull traps, etc. Regardless of what you want to name them, the setups are great because the levels are usually so well defined.
Today we are looking at the Russell2000 exchange traded fund breaking out to new highs this year only to get back down to that former breakout level represented by the highs in March, June and December of last year. Let’s call it $121. This is a weekly chart so we can see how when prices broke out this year, they have remained above those former highs, but notice how momentum did not confirm and put in a bearish divergence.
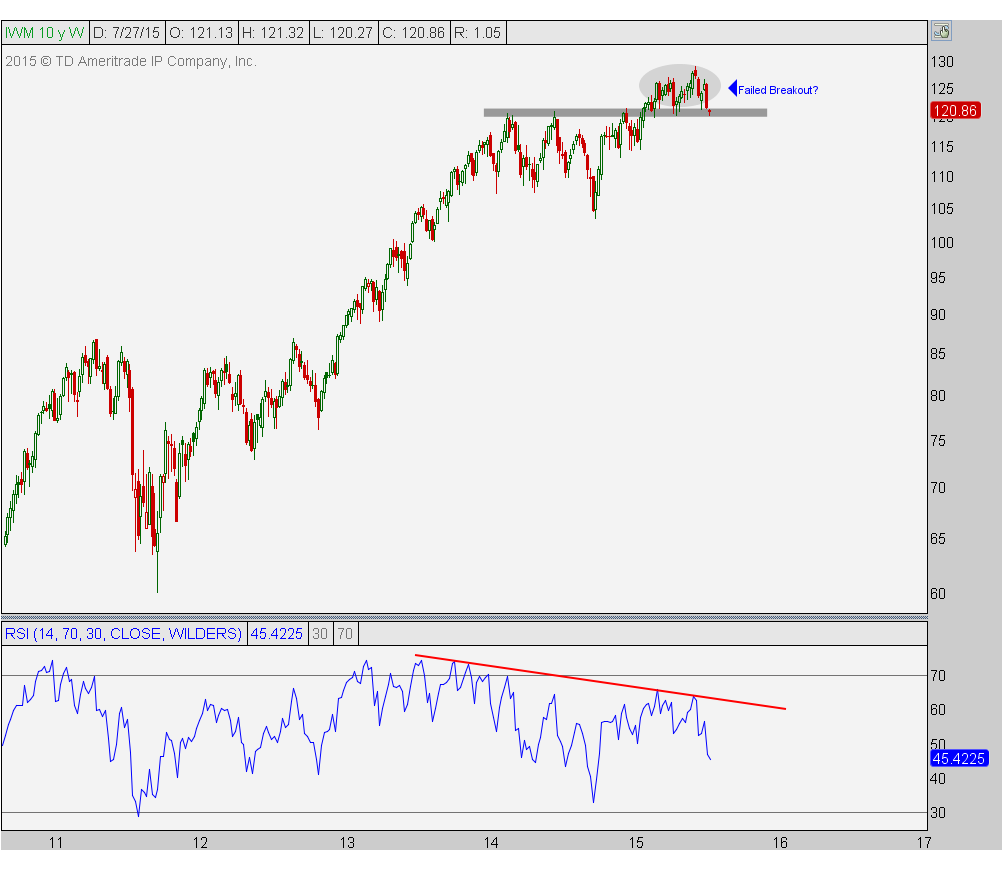
When markets make new highs we want to see momentum putting in new highs as well. We use a 14-period RSI to represent momentum. In this case, not only did momentum not put in new highs to confirm the new highs in price, but RSI did not even hit overbought conditions. We’ve been making lower highs now for almost 2 years.
I don’t see any reason to be long the Russell2000 if prices are below $121. If we’re above that then $IWM is fine. The good news is that we have a very well-defined level, which to us is the most important thing. I would not be short $IWM if prices are above $121, but below that and shorts are fine in my opinion.
***
Click Here to receive weekly updates of this chart on multiple timeframes including the S&P500, Dow Industrials, Nasdaq100 and the other major U.S. stock market indexes.
Recent free content from J.C. Parets
-
 Here’s Way I think Rates Are Heading Lower
— 11/12/15
Here’s Way I think Rates Are Heading Lower
— 11/12/15
-
Support & Resistance 101: Apple Edition
— 11/10/15
-
 Video: Technical Analysis Webinar by JC Parets
— 10/01/15
Video: Technical Analysis Webinar by JC Parets
— 10/01/15
-
Find Your Edge: The Autumn 2015 AlphaShark Trading Symposium with a Presentation by J.C. Parets
— 9/25/15
-
Can Financials Correct 30% From Their Highs?
— 9/24/15
-
{[comment.author.username]} {[comment.author.username]} — Marketfy Staff — Maven — Member

- 1 Campus Martius, Suite #200Detroit, MI 48226
- +1 877 440 9464