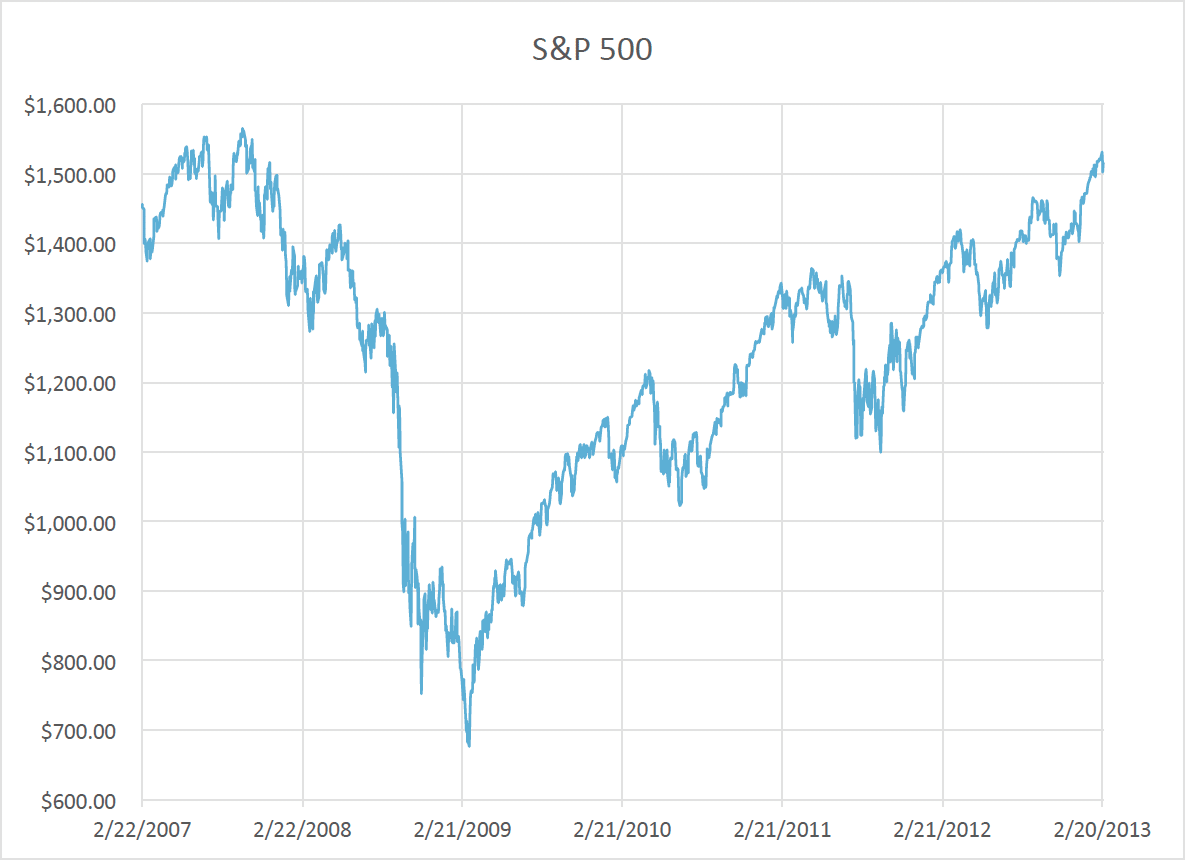
For about the past four years, the market has been in an undeniable uptrend. There have been periods when the market has been stagnant or even bearish for a short period, but the market has always plowed through and continued higher.

S&P 500 – Source http://finance.yahoo.com/q?s=%5EGSPC
This bullish market follows the very significant recession and market crash which occurred 2007 through 2009. While the causes of that bearish market are debatable, the bullish move is undeniably the result of the unprecedented moves taken by the Federal Reserve.
The mandate of the Fed is to promote maximum employment, stable prices and moderate long-term interest rates. As a result of the crises leading to the market decline, the Fed has opted to employ unconventional tools to improve the economy. Primarily, these tools are keeping the Fed Funds Rate at essentially zero and increasing the Fed’s Balance Sheet by purchasing long term government securities.
Consider the chart below which shows the Fed Funds Rate since 1955. What is especially noteworthy is long duration of essentially 0% interest rate that has been in place for the past four years.
Data Source: FRED, Federal Reserve Economic Data, Federal Reserve Bank of St. Louis: Effective Federal Funds Rate (FEDFUNDS); http://research.stlouisfed.org/fred2/series/FEDFUNDS; accessed March 2, 2013.
When you consider that we have only ever been close to these interest rates one time in history, it can be little frightening to consider the duration of the current monetary stance that market is currently enjoying.
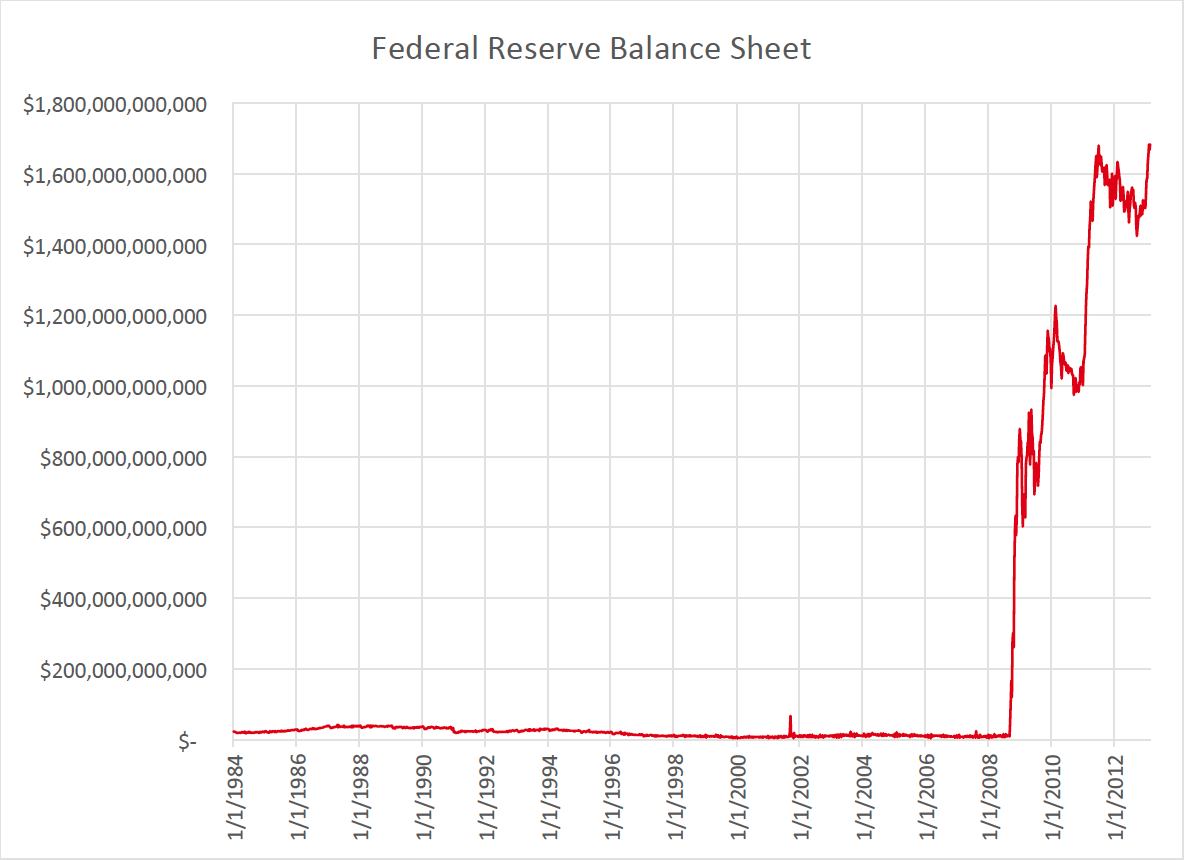
In addition to exceptionally low interest rates, is the unprecedented amount of assets which the Fed has added to its balance sheet. The impact of purchasing securities is an increase in price and a reduction in yield on those government bonds. Lower yields on mortgage backed securities also means lower mortgage rates for homeowners. The other effect of lower yields is that investors will seek other securities to get better returns on their investments. The theory is that this combined effect will improve the overall economy.
Below is the Fed Balance Sheet since 1984. It is very striking to see the dramatic increase that has happened since the market crash. The last reading as of February 27, 2013 was $1,683,532,000,000.

Reserve Balances with Federal Reserve Banks
Source: FRED, Federal Reserve Economic Data, Reserve Balances with Federal Reserve Banks (WRESBAL), Board of Governors of the Federal Reserve System - H.4.1 Factors Affecting Reserve Balances Not Seasonally Adjusted as of 2013-03-01 8:48 AM CST
While these numbers are shocking and open the door for some interesting debate, that is not the purpose of this analysis. The purpose is to determine the impact on the market and how we can use that to our advantage.
What a trader wants to know is:- What is moving the market?
- How long will it continue to move the market?
The impact of the increasing Fed balance sheet is that traders will shift their focus to other assets. Some of those will be stocks and ETFs. The more demand for stocks, the higher the stock market will go.
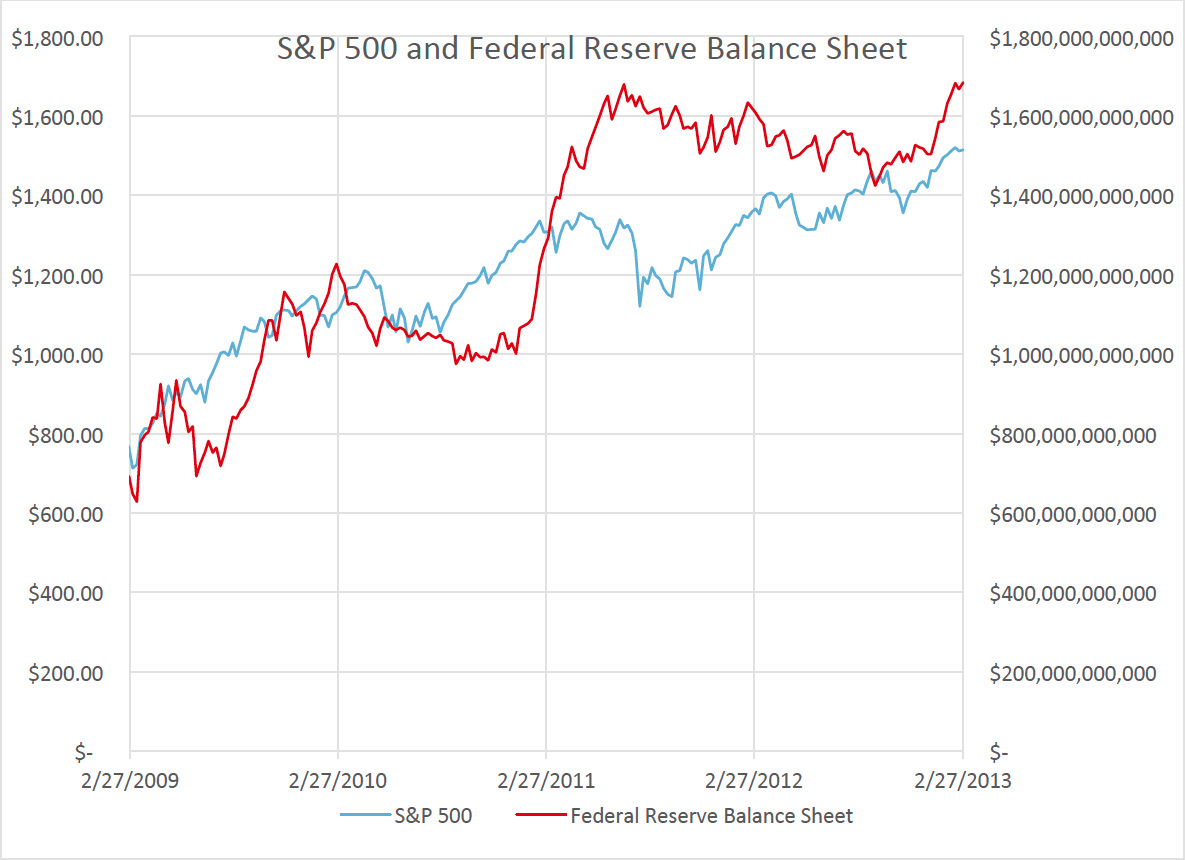
The chart below shows the S&P 500 and the Fed Balance Sheet over the past four years. While the charts do not move in lockstep, they are trending in the same direction. A simple correlation analysis shows that they are related. These two data sets have a correlation R2 of 83%. That is high enough to conclude that the two are correlated.
With this information, what is a trader to do?
There are two basic conclusions that I make from this analysis. The first is that as long as the Fed continues to maintain the current low interest and expanding balance sheet policy, the market will continue to rise. As the saying goes “Don’t fight the Fed.” There will be pullbacks and stagnant periods, but the market will trend higher. Those dips and lags may serve as good points for traders to take profits or enter new positions, depending on the trader’s entry position.
I believe the more significant conclusion from this analysis is that traders must beware of what will happen when the current monetary policy ends. It appears that the policies will continue into the foreseeable future. At least that is the indication we can garner from the Fed meeting minutes and members’ speeches.
However, the accommodative stance of the Fed cannot continue forever. The intent of the this policy was to kick-start the market and get the economy rolling to a point where the easing would go unnoticed because the growth would be driving the market. But the market has grown accustom to this artificial stimulus. And just like a spoiled child, it seems to throw a panic when there is any hint of ending the policy.
I think a good comparison is like drinking a Monster Energy Drink (MNST) to get a boost. If you drink too many for too long they start to lose their effect. And, eventually you get the point where you need them just to be normal. When you try to cut back you are going to a have a doozy of a headache.
I am afraid that is what our market is heading for – a doozy of a headache.
Therefore, traders must be vigilant and stay alert for signs of changes in the Fed policy. When it happens, you better make sure you have the extra strength Excedrin nearby.
Eric Hale
OptionsANIMAL Instructor
Recent free content from Options Animal
-
 Lesson 1 - The OptionsANIMAL Method
— 11/15/12
-
 Explosive Profits
— 11/05/12
-
 What is a straddle options strategy?
— 4/27/19
-
{[comment.author.username]} {[comment.author.username]} — Marketfy Staff — Maven — Member


