

Beyond The Biotech Space - Tesoro Corporation (NYSE: TSO)
TSO confirms a top
Double tops are reversal patterns and are as simple as they sound: Rallying up to a point (T), selling off to a support, and then rallying back up again to approximately the same prior peak (T).
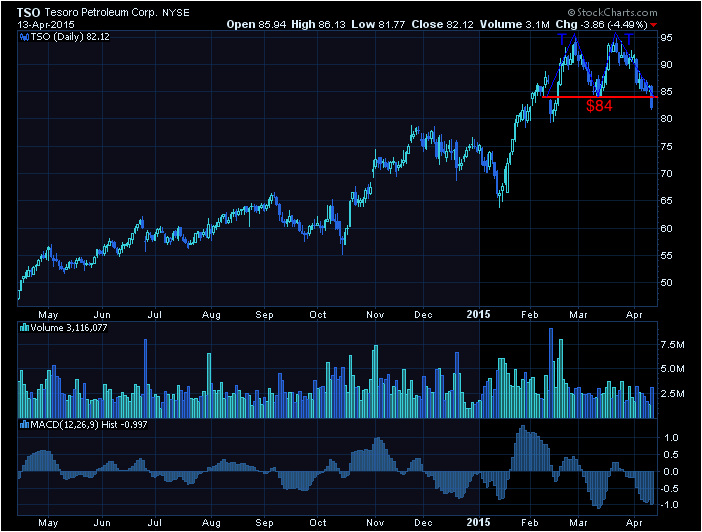
TSO appears to have formed a double top price pattern (blue) over the last 2 months. As with any price pattern, a confirmation of the pattern is needed. TSO confirmed its pattern by breaking the $84 support (red) that was created by the double top pattern.
The Tale of the Tape:
TSO has broken down from its double top and should be moving lower overall. A short trade could be made on any rallies back up to $84, while a long trade could be made if the stock were to break back above that level.
Before making any trading decision, decide which side of the trade you believe gives you the highest probability of success. Do you prefer the short side of the market, long side, or do you want to be in the market at all? If you haven’t thought about it, review the overall indices themselves. For example, take a look at the S&P 500. Is it trending higher or lower? Has it recently broken through a key resistance or support level? Making these decisions ahead of time will help you decide which side of the trade you believe gives you the best opportunities.
No matter what your strategy or when you decide to enter, always remember to use protective stops and you’ll be around for the next trade. Capital preservation is always key!
Good luck!
The Biotech Trader
Recent free content from Christian Tharp, CMT
-
 Biotech Breakdown: Positive Signs Are Building (11/25/15)
— 11/25/15
Biotech Breakdown: Positive Signs Are Building (11/25/15)
— 11/25/15
-
Biotech Breakdown: Market Still Pulling Back (11/12/15)
— 11/12/15
-
Biotech Breakdown: Market Pullback Before New Highs (11/6/15)
— 11/06/15
-
Biotech Breakdown: Market Correction Over? (10/22/15)
— 10/23/15
-
Biotech Breakdown: Markets Up, Biotechs Finally Take Part (10/16/15)
— 10/16/15