

Beyond The Biotech Space - Concho Resources, Inc (NYSE: CXO)
CXO breaks out of the inverse
Over the last 6 months CXO formed an inverse head and shoulders pattern (blue).
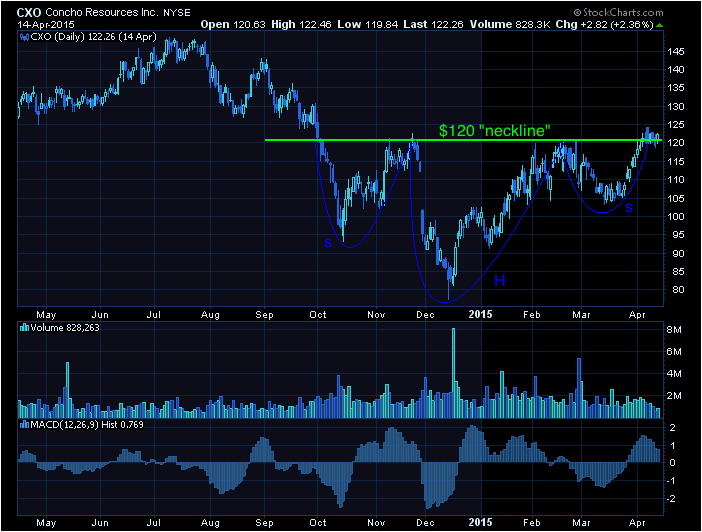
I have noted the head (H) and the shoulders (s) to make the pattern more visible. The stock’s neckline resistance was at the $120 level (green). CXO confirmed its H&S by breaking through the neckline last week.
Keep in mind that simple is usually better. Had the inverse H&S pattern never been pointed out, one would still think CXO was moving higher simply because it broke through its $120 resistance level.
The Tale of the Tape:
CXO confirmed an inverse head & shoulders pattern. A long trade could be entered on a pullback down to the $120 level. A break back below $120 could negate the forecast for a move higher.
Before making any trading decision, decide which side of the trade you believe gives you the highest probability of success. Do you prefer the short side of the market, long side, or do you want to be in the market at all? If you haven’t thought about it, review the overall indices themselves. For example, take a look at the S&P 500. Is it trending higher or lower? Has it recently broken through a key resistance or support level? Making these decisions ahead of time will help you decide which side of the trade you believe gives you the best opportunities.
No matter what your strategy or when you decide to enter, always remember to use protective stops and you’ll be around for the next trade. Capital preservation is always key!
Good luck!
The Biotech Trader
Recent free content from Christian Tharp, CMT
-
 Biotech Breakdown: Positive Signs Are Building (11/25/15)
— 11/25/15
Biotech Breakdown: Positive Signs Are Building (11/25/15)
— 11/25/15
-
Biotech Breakdown: Market Still Pulling Back (11/12/15)
— 11/12/15
-
Biotech Breakdown: Market Pullback Before New Highs (11/6/15)
— 11/06/15
-
Biotech Breakdown: Market Correction Over? (10/22/15)
— 10/23/15
-
Biotech Breakdown: Markets Up, Biotechs Finally Take Part (10/16/15)
— 10/16/15