

Where Are Gold Prices Headed? Watch Silver.
As a technician that looks at multiple asset classes and stock markets all over the world, I treat them all the same. For us it’s just math. Whether we are looking at shares of MSFT, US Dollar Index, Malaysian Stock Market, Treasury Bonds, etc to us they are all the same. For most market participants this is not the case and people tend to be more interested in certain stocks or markets.That’s understandable. AAPL is a good example, precious metals, Oil lately for obvious reasons, etc etc. These days, I’ve been getting a lot of questions about the price of Gold since the yellow metal has gotten the year off started on such a strong note.
So if you want to know where Gold prices are headed, I think your best bet is to watch Silver. They generally move together, although Silver tends to me the more volatile of the two. Nevertheless, I think if you want to know where precious metals are going as a group, Silver is the cleanest one and that’s our tell.
First of all, you guys know I don’t like to assume correlations like we see some other do so often. I want to responsibly make sure that the math adds up. So after running the numbers, the correlation coefficient between Gold & Silver over the past month is +0.9, over the past quarter it is +0.9 and it is also +0.9 over the past year. They move together.
Now, here is a weekly candlestick chart of Silver going back a few years where we can see that key support near 18.50 throughout the second half of 2013 and into 2014 until it broke last September. Our polarity principles tell us that former support should turn into resistance. This is precisely what occurred over the last couple of weeks. This resistance, or “overhead supply”, is what we want to watch going forward.
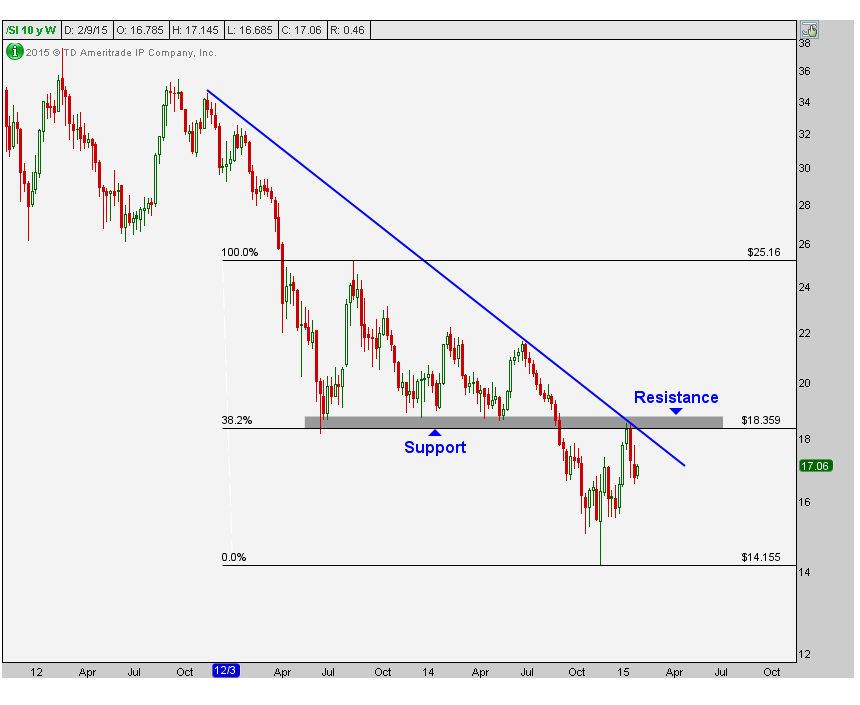
As you can see on this chart, not only does this former support now represent resistance, but this is also where we run into a downtrend line from the highs in late 2012. In addition, the 18.35 level is exactly the 38.2% Fibonacci retracement from the entire August 2013 – November 2014 Decline. There is a big cluster of resistance levels here that we simply cannot ignore.
Until prices are above all of that resistance, I don’t see any reason to be long precious metals, particularly from a structural perspective. Sure, there will be some volatility and plenty of ups and downs for short-term traders to take advantage of. Therefore, I think it is more important than ever to define your time horizon. To simply ask, “Where is gold going?”, is a bad question. You mean, in the next 10 minutes? Tomorrow? Next month? Next year? Time horizons have to be defined.
As far as I’m concerned, I generally use weekly and daily charts to first get a structural bigger picture perspective, and then break it down to a shorter timeframe for executions. Right now, I do not see any reason to be long precious metals, for my time horizon. I think if Silver can break out and stay above the cluster of resistance levels mentioned above, then we can look to put money on the long side. Until then, I don’t see anything to do here.
***
REGISTER HERE to receive weekly updates on Silver and Gold charts looking at multiple timeframes.
Recent free content from J.C. Parets
-
 Canadian Dollars Are About To Explode Higher
— 10/07/15
Canadian Dollars Are About To Explode Higher
— 10/07/15
-
Gold Looks Ready For Its Next Leg Lower
— 9/30/15
-
Find Your Edge: The Autumn 2015 AlphaShark Trading Symposium with a Presentation by J.C. Parets
— 9/25/15
-
Why Yen Is The Most Important Chart For US Stocks
— 9/17/15
-
Is Silver Ready For Its Next Leg Lower?
— 9/16/15
-
{[comment.author.username]} {[comment.author.username]} — Marketfy Staff — Maven — Member

- 1 Campus Martius, Suite #200Detroit, MI 48226
- +1 877 440 9464