

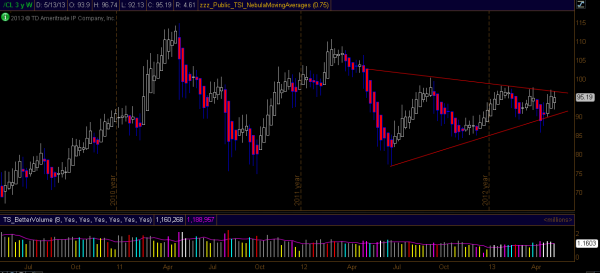
NYMEX Light Sweet Charts
NYMEX Light Sweet is beginning to close its weekly triangle. Prices have struggled to move higher in 2013 due to a strengthening USD and a weak demand outlook in light of increasing production. The 2013 Oil Market Report issued by IEA for May highlighted the increased global oil demand forecast by a marginal 65 kb/d for 2013, to 90.6 mb/d, due mainly to upward revisions to German gas/oil data for 2012.
NYMEX 30 Minute Chart:
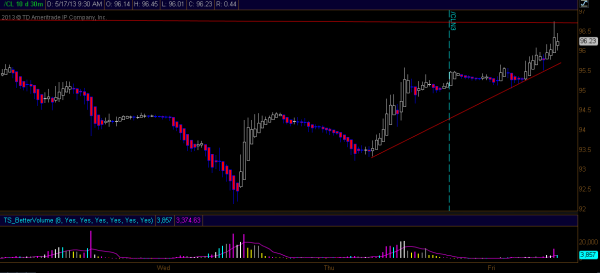
Overall, the outlook on the oil complex is bearish as OPEC announced seaborne oil shipments would rise by 220K barrels a day in the four weeks to June 1 (during May), compared with the previous four-week period. With the recent insight into the still weak US housing market and industrial market, expect prices to decline as more product is pumped into inventories and the USD continues to appreciate.
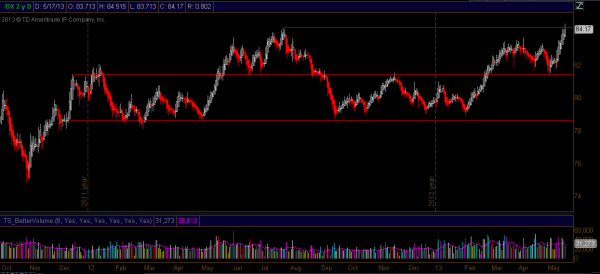
USD Daily Chart:
Recent free content from Sang Lucci
-
 A Squeaky Wheel…
— 5/23/13
A Squeaky Wheel…
— 5/23/13
-
Exchange Coddling Of HFT Firms Brought To Light Again
— 5/17/13
-
Margin Credit Driving Market Performance
— 5/04/13
-
Internalization And Why It Matters To Everyone
— 5/03/13
-
 [Webinar] Trading With Twitter
— 5/03/13
[Webinar] Trading With Twitter
— 5/03/13
No comments. Break the ice and be the first!
Error loading comments
Click here to retry
No comments found matching this filter
-
{[comment.author.username]} {[comment.author.username]} — Marketfy Staff — Maven — Member
Want to add a comment? Take me to the new comment box!

- 1 Campus Martius, Suite #200Detroit, MI 48226
- +1 877 440 9464