

My Favorite Gap And Go Setup in Real Time
Any form of market analysis is always best when you have the advantage of hindsight. How easy is it to point out a particular pattern, after the fact, and say, “That was it. That was the entry point right there!”. We’re all guilty of it, myself included. So today I want to go over one of my favorite patterns while discussing one setting up in real time.
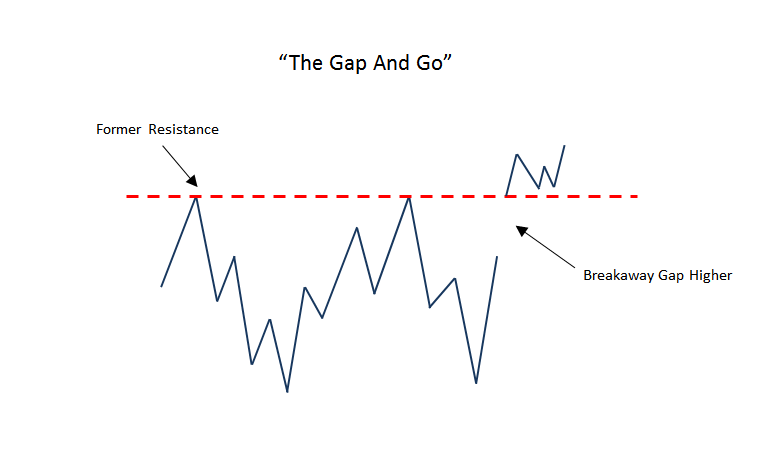
The Gap and Go pattern is simple. We need three things: A breakaway gap higher, former resistance levels above head prior to the gap, and the opening price after the gap has to be above that aforementioned resistance. As long as prices remain above that former overhead resistance, we can buy it all day. This is what it looks like:
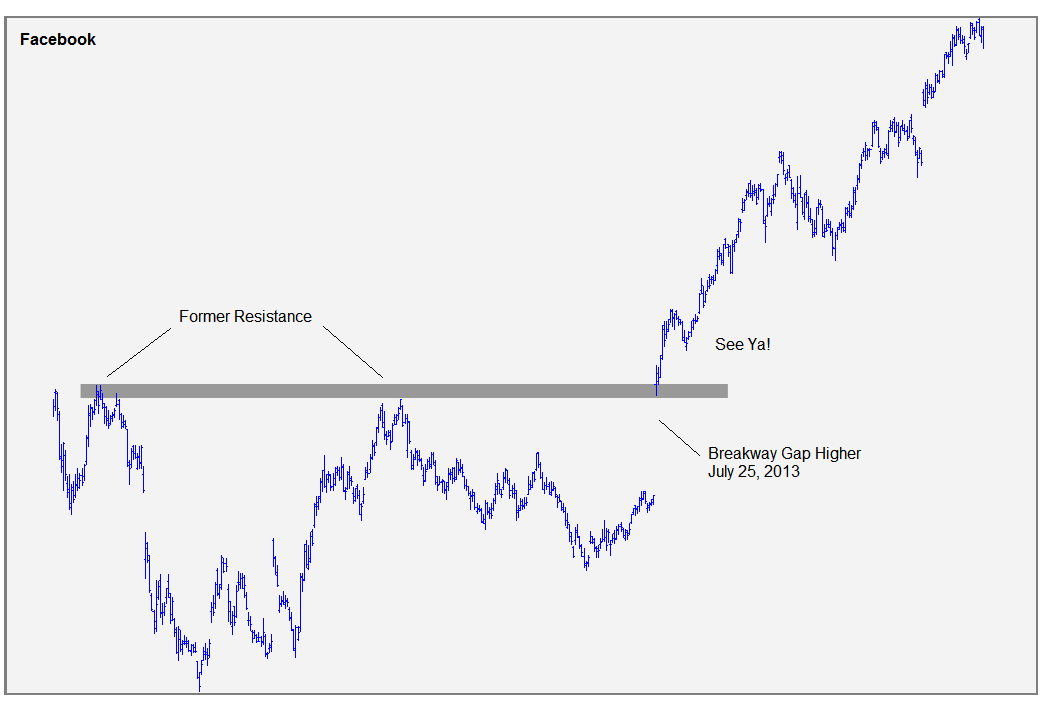
 We saw this in shares of Facebook back in the summer of 2013.
- Breakaway Gap Higher
- Former overhead resistance prior to the gap
- Opening price after gap above resistance
We all know what happened after that….
The idea is that you buy it all day above that former resistance, or overhead supply, with stop losses below that period’s open. We don’t want to be in these things if they start to fill in their gap. By definition this can no longer be a “Gap and Go”. If it rolls over, it is essentially, ‘Gapping and Going Nowhere’. So this setup therefore creates a risk/reward very much in favor of the bulls, which to us is all that matters: finding a favorable risk reward.
Today we’re looking at shares of Linkedin that did the same thing earlier this month. We have the Breakaway Gap Higher on February 6th, former overhead supply from September 2013 and the opening price of the gap is above that resistance. These are the ingredients that we look for in order to have this extremely favorable risk/reward scenario:
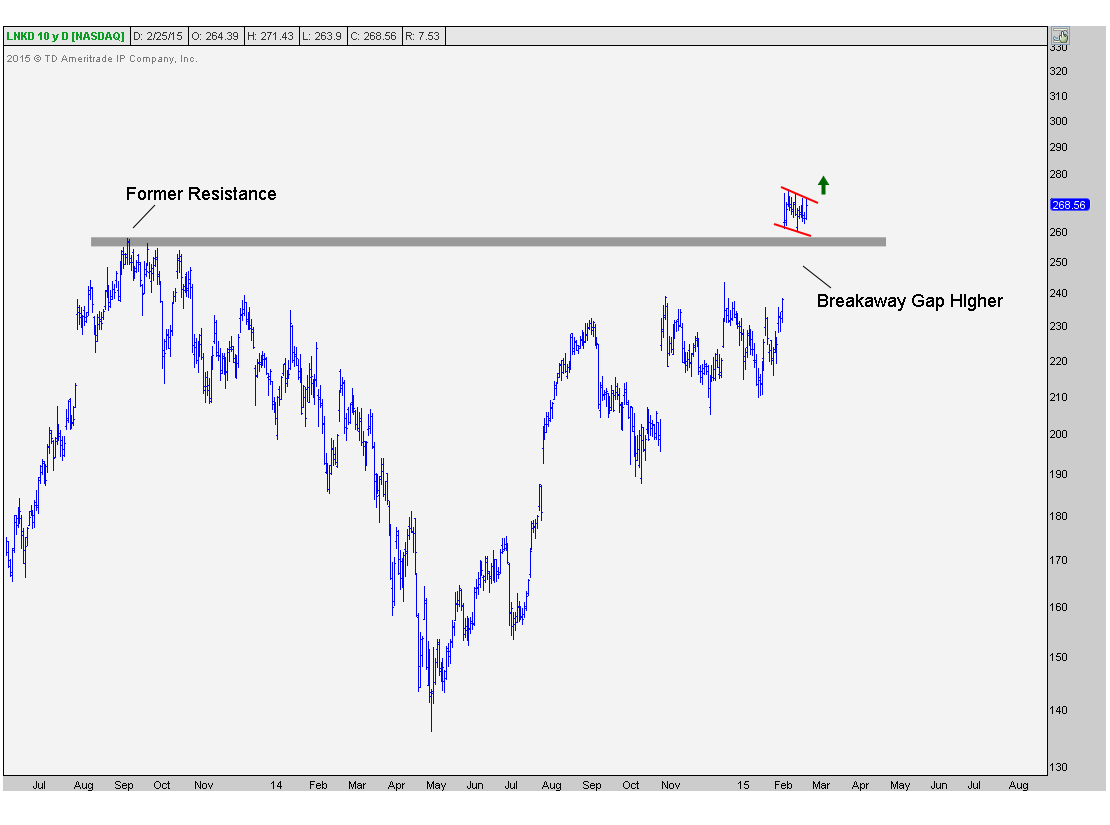
If prices a start to fill in this gap, we don’t want to be in it. It’s that simple. But in this case, we actually have what I would consider to be a nice little bull flag since that breakaway gap earlier in the month. This is also a bullish pattern and I would actually prefer to be a buyer of an upside resolution out of this 2-3 week bull flag.
The risk/reward here very much favors the bulls, particularly on an upside breakout above the February highs. Let’s see what happens….
***
Click Here for more information on our Premium Technical Research Packages
Recent free content from J.C. Parets
-
 Miami This Week For The Finance Festival
— 11/04/15
Miami This Week For The Finance Festival
— 11/04/15
-
The Nasdaq Flirts With All-Time Highs
— 11/02/15
-
 Video: Technical Analysis Webinar by JC Parets
— 9/29/15
Video: Technical Analysis Webinar by JC Parets
— 9/29/15
-
Overhead Supply in Healthcare & Biotech
— 9/22/15
-
Thinking Out Loud Heading Into Q4
— 9/22/15