

Where Is The S&P 500 Heading Now?
The S&P500 has been one of the cleaner markets around the world since resolving its tight range that it had been stuck in since February. What had been a really sloppy environment with whipsaws in both directions for about 6 months, broke down cleanly and volatility spiked. Support was found where demand has been in control in the past (October), and the ensuing bounces rolled over nicely where they should have, at former support from Q1 (see here). In addition, when markets are in an unusually tight range, as they were for so long, the resolution out of that tends to be volatile in nature, regardless of direction. We see this all the time. As I mentioned when we first broke down, the new problem that the S&P500 has is that what was former support for so long, now becomes overhead supply. The “just get me back to even” crowd is sitting there ready to sell to you on any rallies. Here’s what I see now:
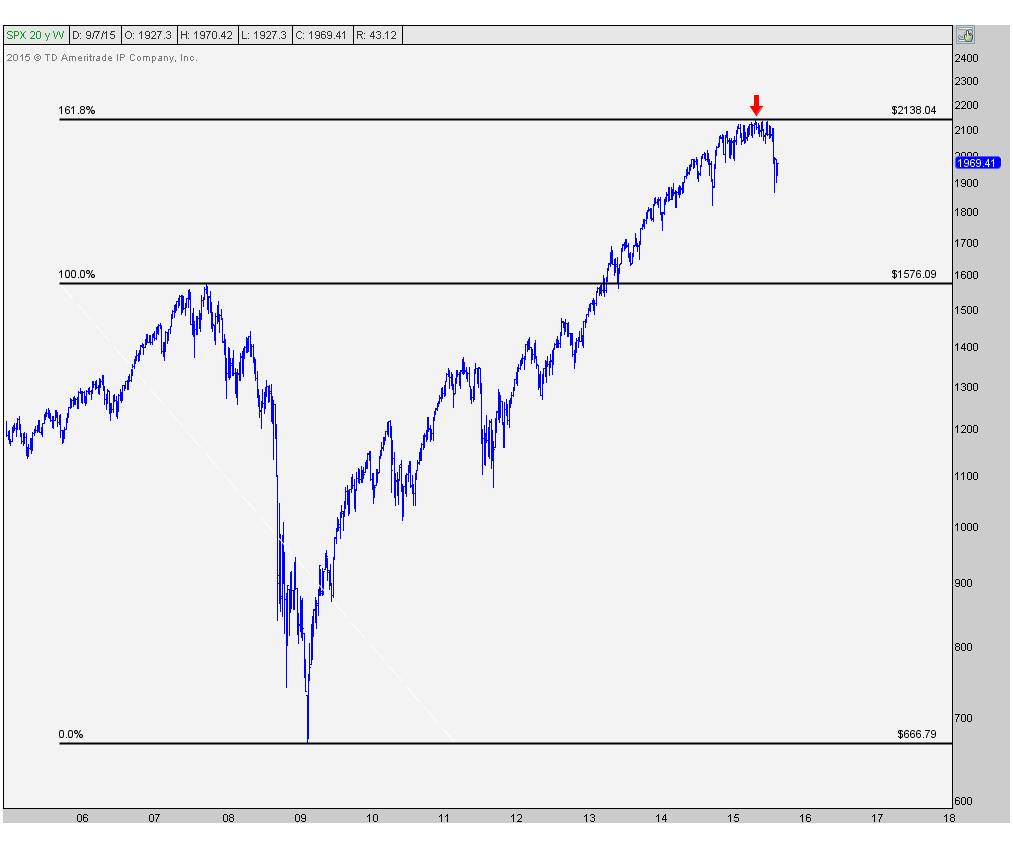
This is the first chart that had us cautious since the end of the first quarter. This market rallied right up to the 161.8% Fibonacci extension of the entire 2007-2009 decline. The market respects these levels, so obviously I think it would be irresponsible of us not to:
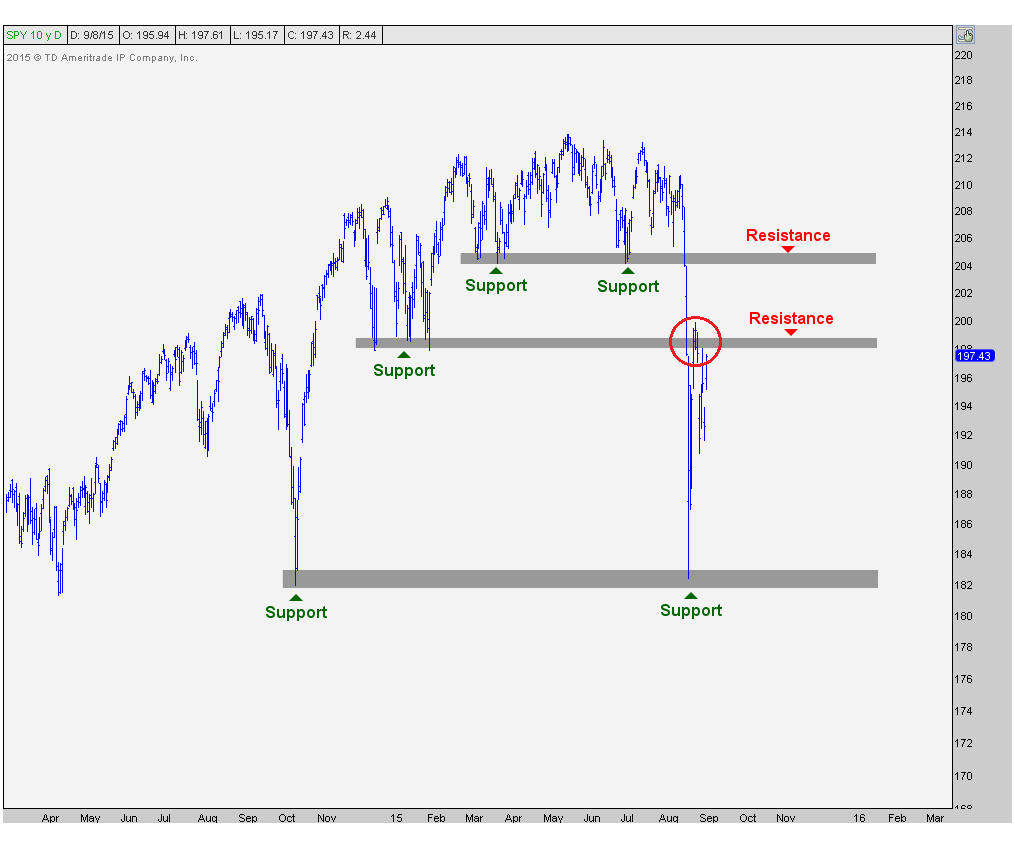
Looking a little bit closer, here is the daily timeframe where support from October held last month and then the broken support in Q1 turned into resistance the past couple of weeks. We’ll stick to bars just to keep things simple. This is the S&P500 exchange traded fund $SPY. Also notice that if S&Ps manage to get back above the support from Q1, there is still more overhead supply that it has to absorb. This is literally a problem on top of another problem:
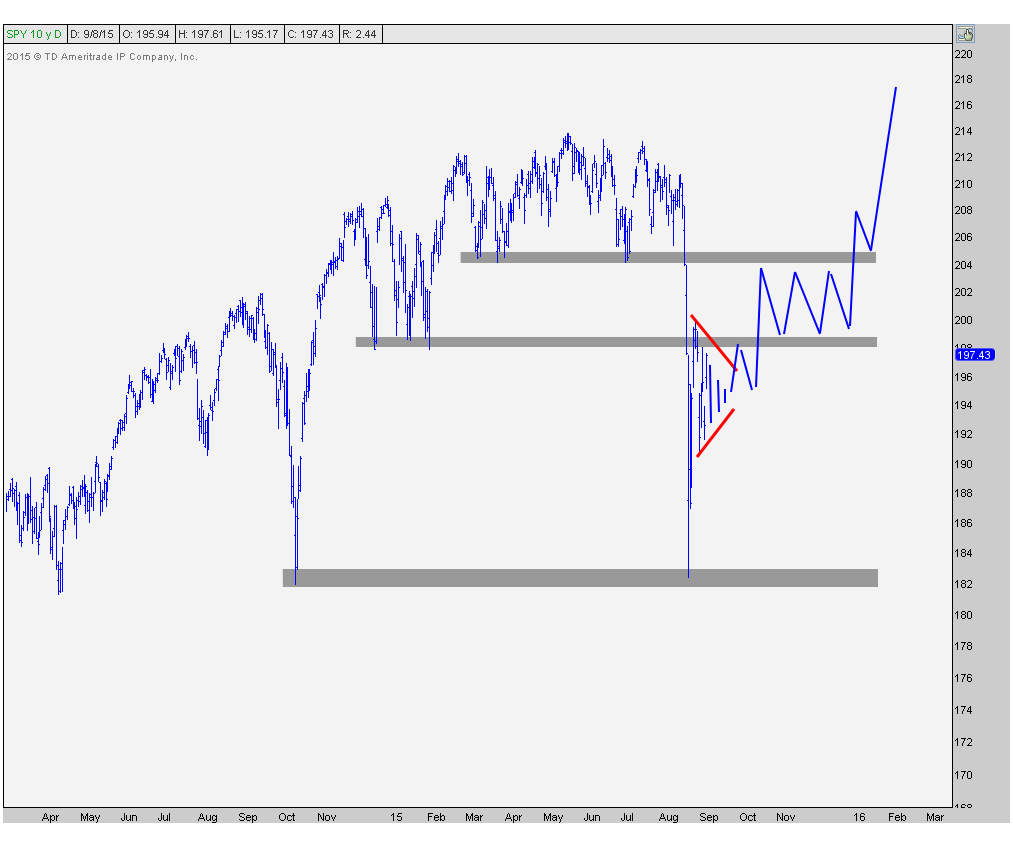
So I think this can play out in a number of ways. The most bullish scenario, in my opinion, is that prices are able to quickly get above and stay above that former support from Q1 near $198 and begins to put in a base below that next resistance level near $204. This would be a healthy scenario, that although might seem frustrating for the rest of the year, should lead to the best outcome and ultimately new all-time highs in the first quarter of next year some time. I think this is the lower probability outcome and not one that I’m willing to bet on today:
 From where we stand today, I believe the higher likelihood here is that we continue to consolidate in a tightening range, like we’ve been doing for 2 weeks, and then resolve lower. One of the things that keeps me skeptical of this market is that momentum hit oversold conditions for the first time all year. We use a 14-period RSI that tends to stay above oversold readings during uptrends. We are not in an uptrend if momentum is getting oversold. I think a retest of those lows is the higher probability outcome, which keeps me in a sell strength mode, rather than a buy dips, at least from a more intermediate term perspective. I personally look out weeks and months, not minutes and days like some others.
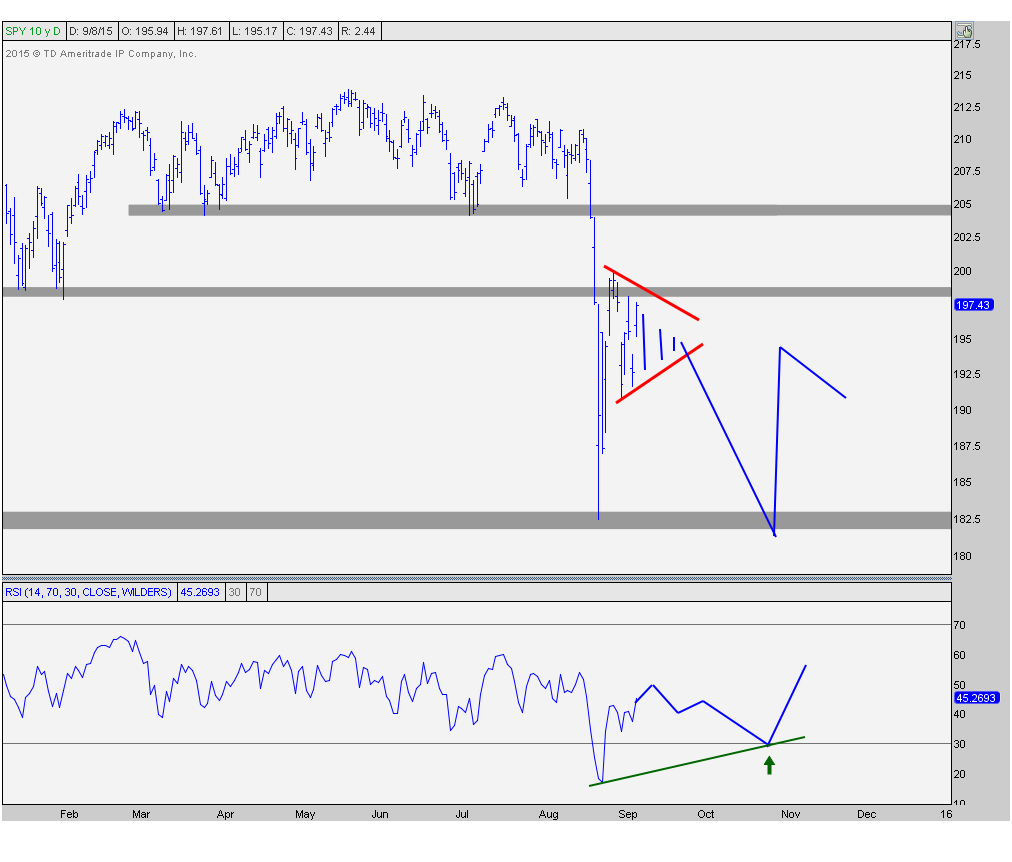
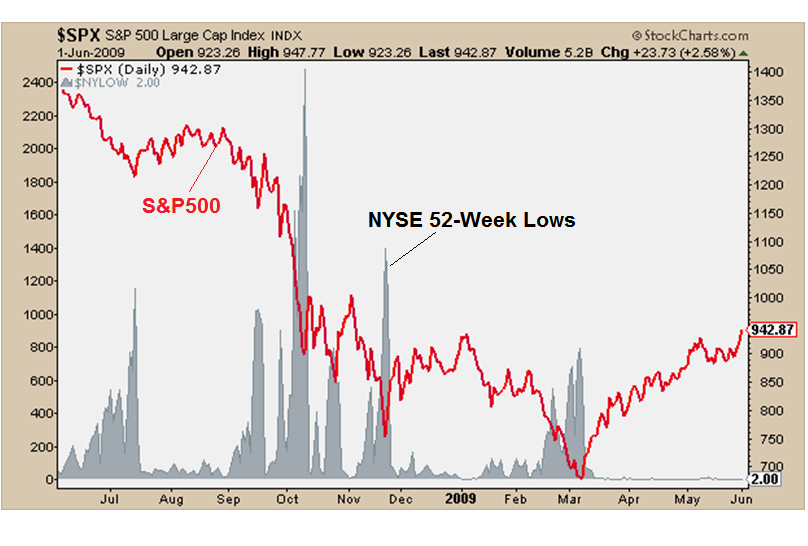
This retest of last month’s lows could come with a brief whipsaw to new 52-week lows before recovering. That would be ideal because it would shake out some more weak hands and that can be it. When those last longs throw in the towel and say, “ugh I can’t anymore, just get me out!”, that’s how bottoms develop. In this scenario, we would want to see fewer stocks make new lows. Going forward, the stocks that put in a higher low when the market puts in a new low, are the ones that tend to outperform afterwards.
A good example is at the March 2009 lows. The majority of stocks put in new lows in October of the previous year. That was the actual market low, not March as the indexes would indicate. In November fewer stocks made new lows, and by the time March came around and the S&P500 was making its final low, most stocks had already bottomed and begun their epic rallies. Here is the chart I have saved from back in the day comparing the S&P500 to the amount of new 52-week lows on the New York Stock Exchange:
 This is clearly a much more dramatic scenario, but a good one to keep in mind as we’re searching for which stocks and sectors to buy on dips and which ones to avoid as they will most likely under perform if they have not yet bottomed out like others.
Backing things up a little, I want to take a look at another outcome that some people might not want to hear. In fact, the bag holders that never sold this year, that now represent all of the overhead supply, are the last ones that want to hear this. This is a longer-term chart showing prices breaking both the support levels mentioned before and also the most recent uptrend lines since the 2012 and 2013. This also adds to the overhead supply as former trendline support also tends to turn into new resistance on kick backs. A rollover here would lead to arguably the 4th test of support near $182. The more times that a level is tested, the higher the likelihood that it breaks. Long-time readers of the blog and subscribers to our research know this all too well:
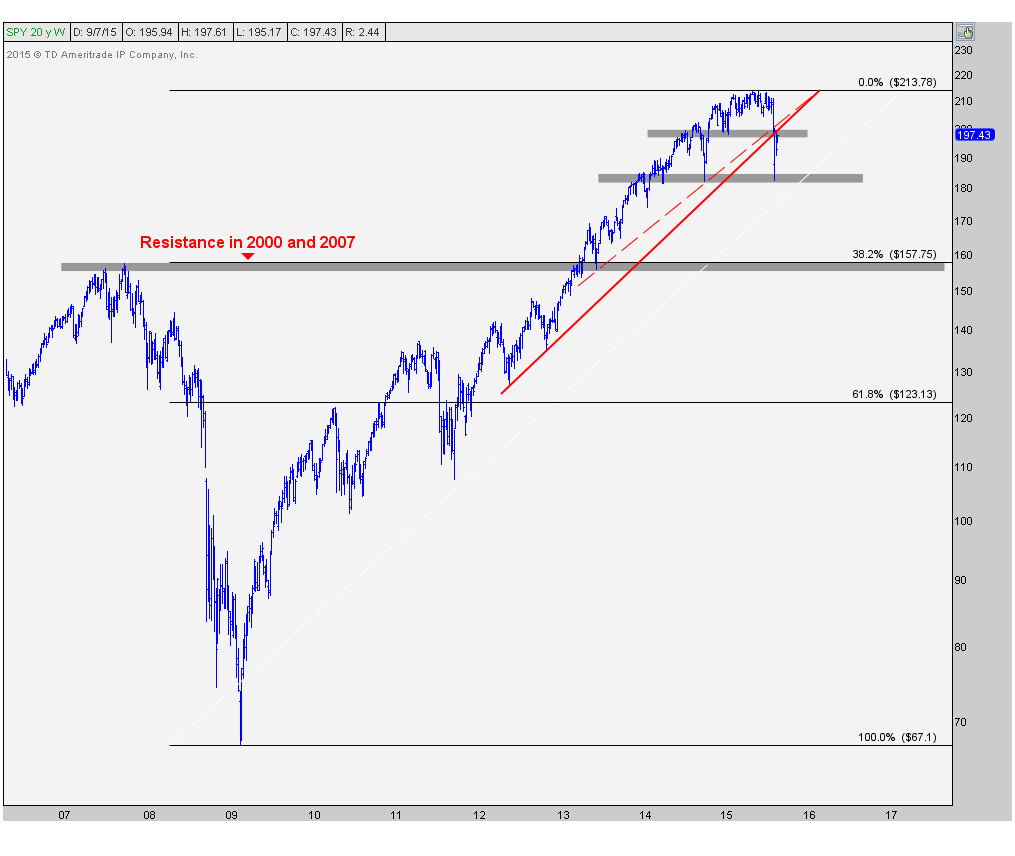 In the case of a break to new 52-week lows, I would have to say that we would likely head under $160 which was former resistance back in 2000 and 2007. This level also represents the 38.2% Fibonacci retracement of the entire 2007-2009 decline. To me, it’s when these levels cluster together like this that they really stand out.
To me, this is the highest probability outcome. The equivalent level on the S&P cash and futures markets is about 1575. This would represent a 26% market correction from top to bottom and perfectly normal for a market that went up 220% over the prior 6 years. I know people will kick and scream about the Fed and China and Obama and whatever other lame excuse they want to make up, but again, this is just normal market behavior.
In order to invalidate some of the bearish activity we’ve seen over the past month, breaking all sorts of support levels leaving so much overhead supply to absorb, a quick recovery as outlined in outcome number 1 above is likely required. Again, I think this is the lower probability scenario and outcome #3 is most likely from where we sit today, but we always want to keep an open mind. It’s the stubborn ones that think they know more than the market that get killed in the end. I always like to come up with multiple scenarios because I know for a fact that I do not know what will happen tomorrow, or ever for that matter. Today, I’m betting on #3. I think S&Ps correct 26%.
REGISTER HERE to receive weekly updates on all of these charts, as well as similar multi-timeframe analysis for the rest of the major averages, including the Dow Jones Industrial Average, Nasdaq100, Russell2000, etc.
Recent free content from J.C. Parets
-
 Here’s Way I think Rates Are Heading Lower
— 11/12/15
Here’s Way I think Rates Are Heading Lower
— 11/12/15
-
Support & Resistance 101: Apple Edition
— 11/10/15
-
 Video: Technical Analysis Webinar by JC Parets
— 10/01/15
Video: Technical Analysis Webinar by JC Parets
— 10/01/15
-
Find Your Edge: The Autumn 2015 AlphaShark Trading Symposium with a Presentation by J.C. Parets
— 9/25/15
-
Can Financials Correct 30% From Their Highs?
— 9/24/15
-
{[comment.author.username]} {[comment.author.username]} — Marketfy Staff — Maven — Member

- 1 Campus Martius, Suite #200Detroit, MI 48226
- +1 877 440 9464