

Accord in the Fed
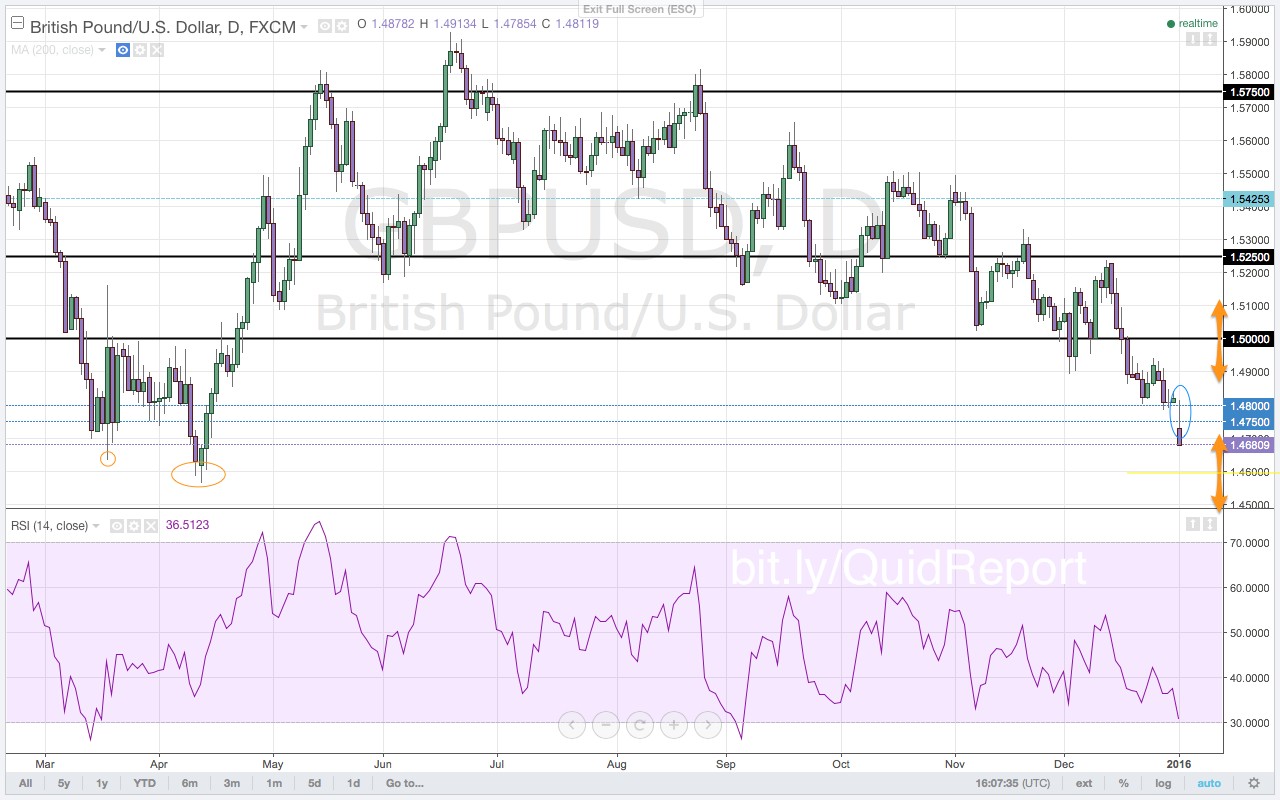
The new year opens with a very significant start for the pound against the U.S. dollar. The only other time in recent history that the GBP/USD opened the new year at lows was back in January 2002. At that time, the GBP/USD bottomed as buying momentum picked up with the RSI finding support at the 40.0 level on the monthly chart. This time, however, is actually a bit different. Momentum is sliding to lows on the RSI. The GBP/USD has gapped lower as the first trading week of 2016 gets underway. This gap down has cleared the zone of support between the 1.4750 level and the 1.4800 level. This zone has been an area of supply for the GBP/USD eight times in the past sixteen years. It supported price last week as sellers took profits and established new positions against the support zone. Now this gap and subsequent move lower is a strong indication of further selling in the GBP/USD. Strong economic reports from the UK may give sellers a reprieve. But the calendar is dominated by economic news out of the United States this week. Risk aversion is already entering markets as U.S. equities open 2016 with pronounced weakness. Any strong news about the U.S. economy is likely to rally the U.S. dollar further. Having broken below the 1.4680 level, the GBP/USD is poised to test lows at 1.4565.
Premium trade setups with targets and stops are published in the GBP/USD Outlook for the Week in Volume 44, this week's Quid Report.
Recent free content from Lydia Idem Finkley
-
 USD Leaves Markets in Suspense
— 6/15/16
USD Leaves Markets in Suspense
— 6/15/16
-
ECB Keeps Euro Happy
— 6/02/16
-
Cable is Breaking but Not Really
— 4/19/16
-
Remember, The Euro is a Safe Haven
— 4/17/16
-
NEW: The Monday Morning Calls
— 4/11/16
-
{[comment.author.username]} {[comment.author.username]} — Marketfy Staff — Maven — Member

- 1 Campus Martius, Suite #200Detroit, MI 48226
- +1 877 440 9464