

My Back-of-the-Napkin Take
In yesterday's missive, I began a back-of-the-napkin review of market conditions. For me, the question at hand is whether the bulls will be able to break out of the trading range that has been in place for the past two and one-half months. I stated that in situations like these, I like to look at the macro backdrop, the historical tendencies, and my market models for clues.
We began with a big-picture review of the macro situation, concluding that stocks remain in a secular bull market and that unless accompanied by a recession, any meaningful decline in the stock market is likely to be shorter and shallower than normal - and that the dips should continue to be bought. We then explored the history of the "Sell in May and Go Away" rule and decided that although the May - October periods haven't exactly been gangbusters in this cycle, there didn't seem to be any big reason for investors to head to the sidelines.
This morning, we will review what the cycle composite is projecting here and take a look at the message from my major market models.
What Do the Historical Cycles Say?
Before we begin, let me say that I do not believe in managing money based on "market calls," predictions, or "gut feelings." No, I prefer to utilize a disciplined approach that is guided by a "weight of the indicators" methodology. In short, I prefer to stay in tune with what the market "is doing" and avoid getting caught up in what I think stocks "should be" doing."
As such, the use of a cycle composite would seem to be counterintuitive. To review, the cycle composite is a combination of all the 1-year seasonal cycles, the 4-year Presidential cycles, and the 10-year decennial cycles going back to the early 1900's.
I have been watching the cycle composite's projections for years. And the bottom line is that, for the most part, stocks tend to follow the general trend indicated by the projection. Not on a day-to-day, or even week-to-week basis. But, again, generally speaking, over longer periods of time, the projection tends to be scary good. And it is for this reason, that I employ the cycle composite's projection as one of the 10 inputs in my weekly market model.
But to be clear, we need to remember that Ms. Market has a mind of her own and will, at times, diverge completely from the historical trends.
Looking at the composite projection for 2017, stocks largely followed the historical script until early February, when the market shot higher instead of moving lower into early March, as the projection had called for. But since the beginning of March, the market appears to be back "in sync" with the historical cycles.
Looking ahead, the composite suggests a dip into mid- to late-May, to be followed by a strong rally through mid-July.
Unfortunately, this is where the good news ends. After a topping phase projected for mid-July through early August, the cycles suggest a meaningful decline to ensue for several months. A decline that would wind up wiping out the years' gains and doesn't finally bottom out until mid-October/November.
So, if the cycle composite holds up this year, investors would be wise to use the projected rally to prepare for an ensuing pullback. Put another way, investors with a longer-term time frame should be ready to buy the dip.
Will the market follow the script through the rest of the year in 2017? Who knows. However, I find it useful to have an inkling of what "could" happen in the months ahead.
What Do My Market Models Say?
Since I do a detailed review of my favorite market indicators and models every Monday morning, I'm going to skip the minutiae and cut to the chase here.
In short, I have four market models that I call my "primary cycle" indicators. These are four very different models designed to provide me with the "state of market." I have been following these models for many years (two since 1993) and I can say that while nothing is perfect in this business, these models tend to get the big picture mostly right, most of the time.
Below is a summary of the current readings of the models from Monday's report.
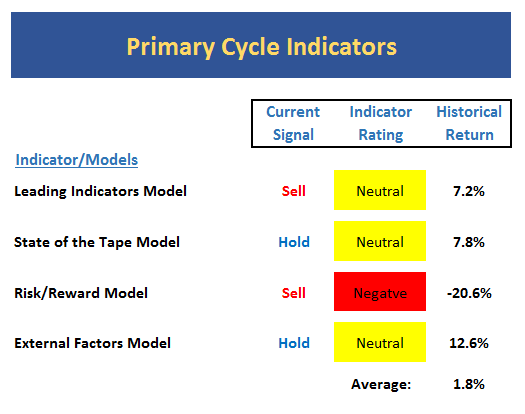
I like to say that you can get a very good feel for the health of the overall market by simply glancing at the colors of boxes that contain the indicator ratings. So, in reviewing the table above, the key is I don't exactly get a warm and fuzzy feeling.
With the market making new all-time highs (microscopic as they may be), one would expect this indicator scoreboard to be sporting a bright shade of green. However, there are no green boxes to be found as the indicators are all neutral - or worse - at the present time.
In fact, two of the four models have issued sell signals in the past few months.
The bottom line message here is simple - risk is elevated and this is no time to have your foot to the floor.
Summing Up
Let's summarize. First, we should recognize that stocks remain in a secular bull market trend. As such, all dips should be bought and bears tend to be shorter and shallower than average. Next, the "Sell in May" rule is in effect. However, as recent history shows, this is not exactly a reason to bury one's head in the sand. Then there is the cycle composite projection, which is calling for a strong rally to begin momentarily and to take the market to new heights. But then later in the summer, the cycles project a nasty pullback that could even qualify as a mini bear. And finally, my favorite, big-picture market models are telling me that all is not right with the market and that some caution is warranted.
If I add these inputs together, it appears that we have an aging bull on our hands where leadership is narrowing and the key internals are weakening. As such, I will conclude that this is not a low-risk environment.
Looking ahead, my guess is that we could see a classic "blowoff" phase commence in the coming months - a type of overexuberant phase that tends to precede meaningful corrections. However, given that there is no reason to believe the secular bull trend that began in 2009 is ending, a buy-the-dips strategy still seems to make sense.
It is for this these reasons that our primary tactical allocation programs are currently in their "lower risk profile" mode. We haven't moved to cash. But we are trying to stay in tune with the state of the indicators by taking our exposure to risk down a notch.
Thought For The Day:
Win or lose you will never regret working hard, making sacrifices, being disciplined or focusing too much. -John Smith
Current Market Drivers
We strive to identify the driving forces behind the market action on a daily basis. The thinking is that if we can both identify and understand why stocks are doing what they are doing on a short-term basis; we are not likely to be surprised/blind-sided by a big move. Listed below are what we believe to be the driving forces of the current market (Listed in order of importance).
1. The State of Trump Administration Policies
2. The State of the U.S. Economy
3. The State of Earning Season
4. The State of World Politics
Wishing you green screens and all the best for a great day,

David D. Moenning
Chief Investment Officer
Sowell Management Services
Disclosure: At the time of publication, Mr. Moenning and/or Sowell Management Services held long positions in the following securities mentioned: none. Note that positions may change at any time.
Looking for a "Modern" approach to Asset Allocation and Portfolio Design?
Looking for More on the State of the Markets?
Disclosures
The opinions and forecasts expressed herein are those of Mr. David Moenning and may not actually come to pass. Mr. Moenning's opinions and viewpoints regarding the future of the markets should not be construed as recommendations. The analysis and information in this report is for informational purposes only. No part of the material presented in this report is intended as an investment recommendation or investment advice. Neither the information nor any opinion expressed constitutes a solicitation to purchase or sell securities or any investment program.
Any investment decisions must in all cases be made by the reader or by his or her investment adviser. Do NOT ever purchase any security without doing sufficient research. There is no guarantee that the investment objectives outlined will actually come to pass. All opinions expressed herein are subject to change without notice. Neither the editor, employees, nor any of their affiliates shall have any liability for any loss sustained by anyone who has relied on the information provided.
The analysis provided is based on both technical and fundamental research and is provided "as is" without warranty of any kind, either expressed or implied. Although the information contained is derived from sources which are believed to be reliable, they cannot be guaranteed.
David D. Moenning is an investment adviser representative of Sowell Management Services, a registered investment advisor. For a complete description of investment risks, fees and services, review the firm brochure (ADV Part 2) which is available by contacting Sowell. Sowell is not registered as a broker-dealer.
Employees and affiliates of Sowell may at times have positions in the securities referred to and may make purchases or sales of these securities while publications are in circulation. Positions may change at any time.
Investments in equities carry an inherent element of risk including the potential for significant loss of principal. Past performance is not an indication of future results.
Advisory services are offered through Sowell Management Services.
Recent free content from FrontRange Trading Co.
-
 Is The Bull Argument Too Easy These Days?
— 8/31/20
Is The Bull Argument Too Easy These Days?
— 8/31/20
-
What Do The Cycles Say About 2020?
— 1/21/20
-
Modeling 2020 Expectations (Just For Fun)
— 1/13/20
-
Tips From Real-World Wendy Rhoades
— 5/06/19
-
The Best Recession Ever!
— 4/29/19
-
{[comment.author.username]} {[comment.author.username]} — Marketfy Staff — Maven — Member


- 1 Campus Martius, Suite #200Detroit, MI 48226
- +1 877 440 9464