

The NEW Daily Decision for 11.19.18 - Near-Term: It's All About The Headlines. Longer-Term: It's About...
The State of the Markets:
A busy few days of entertaining family in Colorado provided a reprieve from the keyboard and the markets over the weekend. Thus, I'm going to let the indicators do most of the talking to start this holiday-shortened week.
Briefly, the question of the day in my mind continues to be whether or not we've seen "THE" bottom of the current corrective phase. Frankly, I can argue both sides of the issue. But the key in the near-term is the fact that we've got a news-driven market on our hands.
At the risk of being labeled Captain Obvious, the two-pronged worries of a potential Fed "overshoot" (defined as the Fed going too far, with rate hikes eventually becoming a drag on the economy) and a prolonged trade war (where the leaders of the world's two largest economies become stubborn and wind up damaging global growth in the process) are the driving factors. Therefore, my guess is that headlines on either issue are likely to determine the direction of the next short-term trend.
Looking at the bigger picture, the issues of slowing global growth and the corresponding multiple investors are willing to place on an earnings stream that could very well wind up being below expectations hold the key to the next intermediate-term trend.
The good news is we've entered a strong seasonal period. For example, after this week, our cycle work projects a rally into the end of the year. And if memory serves, the stock market has never declined in the November-December period following the mid-term elections. Thus, the bulls like their odds here.
On the other side of the field, our furry friends point to the fact that a global recession is underway, most global markets are in "bear market territory," both rates and inflation are on the rise in the U.S., earnings projections for U.S. companies may be too high for the coming year (especially if there are any policy missteps or external events that crop up along the way), and valuations, while improved over this time last year, remain high by historical standards.
So, there you have it; reasons for the current "argument" between the bulls and the bears to continue to play out. And because this will likely lead to "two-way" type of environment, we should probably expect volatility to stay high, for the news to dominate the tape on a daily basis, and for the market to move in a fits and starts fashion.
Finally, I'd like to take this opportunity to wish everyone a wonderful Thanksgiving Holiday!
P.S. If you haven't been to Rocky Mountain National Park in the late fall/early winter, it's definitely something to put on your bucket list!
Now let's turn to the weekly review of my favorite indicators and market models...
The State of the Big-Picture Market Models
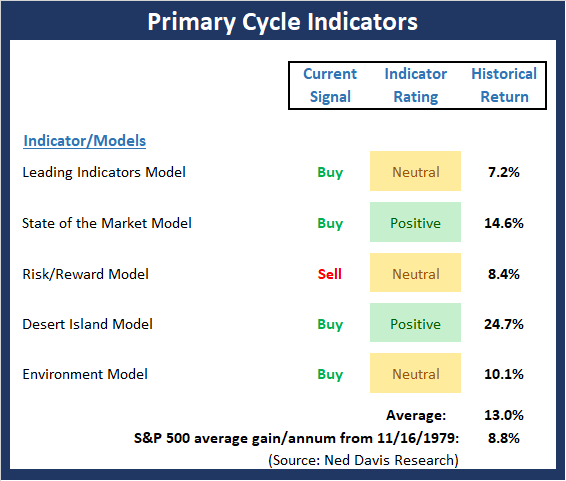
I like to start each week with a review of the state of my favorite big-picture market models, which are designed to help me determine which team is in control of the primary trend.
View My Favorite Market Models Online
The Bottom Line:
-
There was one change to the Primary Cycle board this week as the Environment Model slipped into the neutral zone. But the key message from this board is the secular bull remains intact.
This week's mean percentage score of my 5 favorite models declined to 71.5 (from 72.5%) while the median was unchanged at 75%. Finally, while the historical return of the S&P 500 given the current model readings pulled back a bit this week, the overall reading remains strong and well above the average.
The State of the Trend
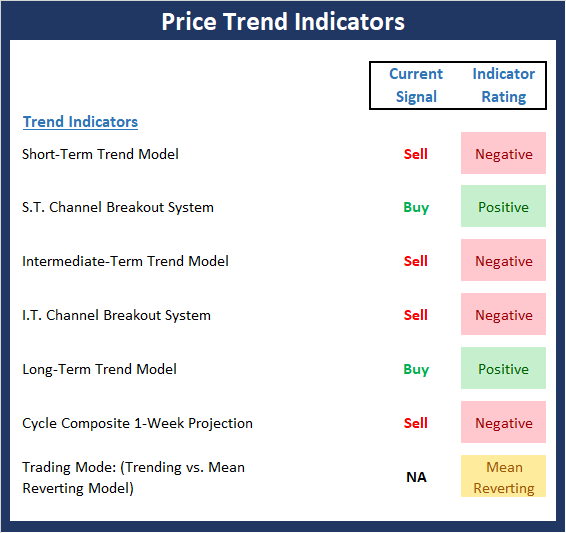
Once I've reviewed the big picture, I then turn to the "state of the trend." These indicators are designed to give us a feel for the overall health of the current short- and intermediate-term trend models.
View Trend Indicator Board Online
The Bottom Line:
- The Trend board weakened a bit this week. However, the key question of the day is if we are seeing a bottoming process, which could lead to the traditional year-end rally.
The State of Internal Momentum
Next up are the momentum indicators, which are designed to tell us whether there is any "oomph" behind the current trend.

View Momentum Indicator Board Online
The Bottom Line:
- From a 30,000 feet perspective, it is hard to argue that momentum is positive as only one of the 7 indicators/models on the board is positive. Yet, at the same time, the board can't be viewed as completely negative either - especially if one lengthens out the time frame past the near-term. Thus, we'll call it "low neutral" for now.
The State of the "Trade"
We also focus each week on the "early warning" board, which is designed to indicate when traders might start to "go the other way" -- for a trade.

View Early Warning Indicator Board Online
The Bottom Line:
- After providing a strong indication that stocks were oversold and due to bounce at the end of October, the "Early Warning" tailwind favoring the bulls has now waned. From a sentiment perspective, the current readings favor the bulls, but are not at "pound the table" levels. In addition, the overbought/sold and mean reversion indicators are mixed. As such, the table is not really "set" for either team at this point in time.
The State of the Macro Picture
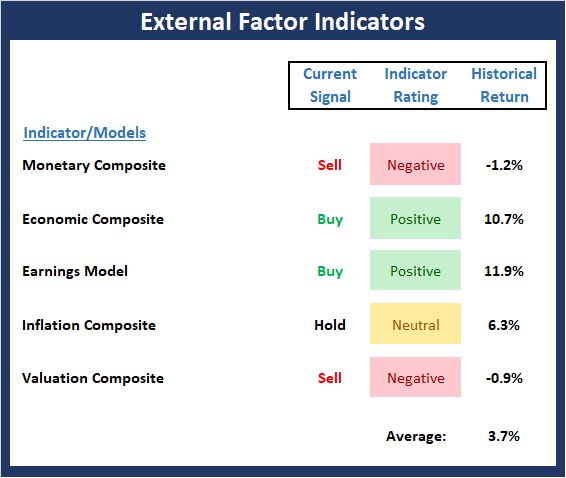
Now let's move on to the market's "environmental factors" - the indicators designed to tell us the state of the big-picture market drivers including monetary conditions, the economy, inflation, and valuations.
View Environment Indicator Board Online
The Bottom Line:
- There are no changes to the External Factors board again this week. However, it is worth noting that the Monetary Composite (which combines 2 models, is a only a whisker away from falling farther, where the historical mean return is -12.9% per year). Thus, the takeaway from this board is that risk factors remain elevated and return expectations are subpar.
Thought For The Day:
The smallest deed is better than the greatest intention. -John Burroughs
Today's Portfolio Review
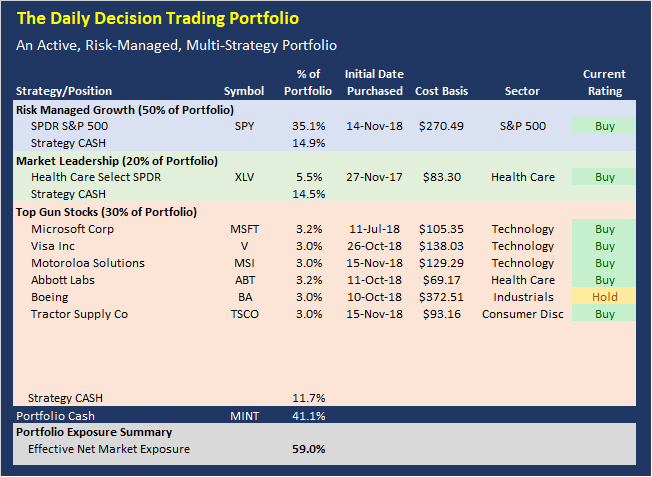
Here is the current positioning of the portfolio and our member ratings:
Effective Net Market Exposure Explained
The Effective Net Market Exposure is the "net long" position of the overall model portfolio after factoring in the impact of leveraged long positions such as SSO and QLD and/or short positions. Leveraged ETFs such as SSO are designed to deliver approximately twice the daily return of the underlying index. Thus, a 10% holding in the SSO equates to a 20% "net long" position to the portfolio.
Current Rating Explained
This is our rating for the day. The Current Rating tells you what action we would take if we did not currently hold the position. A "Buy" rating means we would be willing to purchase the position at current prices. A "Strong Buy" suggests this would be our first choice to buy. A "Hold" rating indicates we would not make new purchases at current levels. And a "Sell" rating indicates we will likely exit the position in the near-term.
Positions Can Change
Positions often change during the trading session. Remember that we will send a Trade Alert via SMS Text Message and/or Email BEFORE we ever make a move in the models.
Disclosure
At the time of publication, the editors hold long positions in the following securities mentioned:
SPY, XLV, AAPL, MSFT, MSI, ABT, BA, WM, V, TSCO
- Note that positions may change at any time.
About the Portfolio:
The latest upgrade to the Daily Decision service went live on Monday, July 9. The new, state-of-the-art portfolio employs a modern, hedge fund style approach incorporating multiple methodologies, multiple strategies, and multiple time-frames. The portfolio is comprised of three parts:
- 50% Aggressive Risk-Managed Growth (up to 300% long)
- 20% Market Leaders
- 30% Top Gun Stocks
The Aggressive Risk-Managed Growth portion is made up of five trading strategies and accounts for 50% of the portfolio. The Market Leadership portion makes up 20% of the portfolio. And the Top Guns Stocks portion (10 of our favorite stocks) will make up the final 30% of the portfolio.
All three of our strategies are run in a single Marketfy model - the model is currently labeled as the LEADERS model. The goal is to make the service simpler to follow by putting everything in one place.
Wishing You All The Best in Your Investing Endeavors!
The Front Range Trading Team
NOT INVESTMENT ADVICE. The analysis and information in this report and on our website is for informational purposes only. No part of the material presented in this report or on our websites is intended as an investment recommendation or investment advice. Neither the information nor any opinion expressed nor any Portfolio constitutes a solicitation to purchase or sell securities or any investment program. The opinions and forecasts expressed are those of the editors and may not actually come to pass. The opinions and viewpoints regarding the future of the markets should not be construed as recommendations of any specific security nor specific investment advice. Investors should always consult an investment professional before making any investment.
Recent free content from FrontRange Trading Co.
-
 The Lines In The Sand Are Clear
— 9/16/20
The Lines In The Sand Are Clear
— 9/16/20
-
The Question of the Day
— 8/04/20
-
Portfolio Update: 1.23.20
— 1/23/20
-
State of the Markets: Modeling 2020 Expectations (Just For Fun)
— 1/13/20
-
Current Holdings for ALL-NEW 2020 Daily Decision Model Portfolio
— 1/03/20
