

The Daily Decision for 1.7.19 - The Magic Words
The State of the Markets:
Well that was fun. Don't look now fans, but after Friday's joyride to the upside, the S&P 500 is up nearly 8% from its Christmas Eve low and is now down only -13.3% from the most recent high water mark. My guess is everybody is feeling a little bit better about the stock market right about now.
The financial media initially credited Friday's jobs report for the stock market's impressive rally. To be sure, both the blowout new jobs number and the uptick in wages were positives from a state-of-the-economy standpoint. And yes, stocks did rally at the open after the report. However, looking at the timing of the day's news and how the indices moved during the session, it is clear that the jobs report was not the true driver of the bulls' big bounce on Friday.
No, it looks like we have Mr. Jerome Powell and his merry band of central bankers to thank for that.
Lest we forget, stock futures were higher well before the eye-popping Nonfarm Payroll data was released Friday morning. Prior to the open, traders reacted favorably to the news that the Chinese had cut their RRR and that a meeting between the U.S. and China to talk trade had been confirmed.
Following the release of the NFP report, futures actually sold off a bit as it appeared that the numbers might be "too good" - meaning that the report could give the Fed cover to stick to their guns on plans to hike rates at least a couple more times in 2019 and to keep the $50 billion per month balance sheet reduction plan (aka QT or the "run off") on "autopilot."
But stocks opened higher and after some initial waffling, continued to advance. As such, it appeared that after some review, the combination of good news out of China and the jobs report was being viewed as a positive.
The Real Story
But make no mistake about it; the real story behind Friday's romp was the about-face from Jay Powell's Fed on the path of rates and the so-called "run off" of the Fed's balance sheet. And this dear readers, could be a game changer.
If you will recall, one of the primary drivers of the pre-Christmas market plunge was Chairman Powell's confirmation that the sale of $50 billion of bonds per month from the Fed's balance sheet was on autopilot. In fact, on December 19th, in reference to the Fed's balance sheet reduction, Powell told reporters at his press conference, "I don't see us changing that."
In response, traders voted with their feet and proceeded to take the Dow down another 2,000 points in the ensuing four trading sessions, ushering in what appeared to be a slow-motion crash. While we can never know for sure why Ms. Market does what she does, one of the primary reasons for the precipitous drop appeared to be the sudden realization that selling $600 billion in bonds during 2019 was the equivalent of (depending on your math) 4-7 additional rate hikes - and that these hikes weren't open to discussion.
The problem here is the Fed has a very long history of "overshooting" during rate hike campaigns and dragging the economy into recession in the process. (If memory serves, the Fed wound up pushing the economy into recession in 10 of the last 13 rate hike campaigns.) While on the surface, it appeared that Powell & Co. had no intention of making a policy mistake (aka doing something stupid), the insistence that the "accidental" rate hikes from the balance sheet reduction plan were on autopilot certainly appeared to be contradictory.
Credit guru Larry McDonald didn't mince words as he voiced his opinion on the subject by writing, "Spending nearly $1T on deficit overloading tax cuts, then lighting it on fire with 8 rate hikes (nine since December 2015) and an experimental $430B of Fed balance sheet reduction, will go down as one of the most destructive policy mistakes in the history of the Republic."
Although several Fed members had tried to walk back the apparent firm stance on both the path of rates and the balance sheet run off, it took the words coming from the man himself to assuage traders' fears over a self-inflicted economic wound.
The Magic Words
On Friday, Powell said the magic words addressing the market's two big fears. First, he said, "With the muted inflation readings that we've seen coming in, we will be patient as we watch to see how the economy evolves."
This is big. In Fedspeak, these words meant that the Fed's projected rate hikes aren't preset and that based on the "data," the next hike was likely on hold. This fits with the "soft" U.S. economic data that has been coming in of late as well as market expectations for rate hikes.
On that note, below is a chart showing the probability of the Fed NOT hiking rates in 2019.
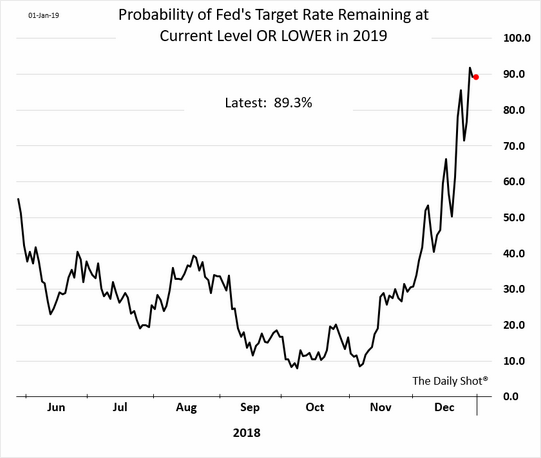
View Chart Online
Image Source: The Daily Shot
As you can see, there has been a rather dramatic shift in "Fed Expectations" since early November, when lots of economic data started coming in punk.
Therefore, the fact that Powell recognized the shifting sands and was willing to publicly admit flexibility on the path of rates was important.
About That "Autopilot" Thing...
However, from my seat, the idea of the Fed pulling back on the two projected rate hikes wasn't the main course here. No, it was the 4-7 "accidental" hikes associated with the balance sheet reduction plan (aka QT) that worried me more.
So next, and in my opinion, more importantly, Powell said, "We wouldn't hesitate" to change balance sheet policy if needed.
There it was; the official proclamation that the Fed wasn't going to do something stupid and "accidentally" push the economy into recession. Phew!
Couple this with the words from Cleveland Fed President Loretta Mester earlier on the day (Mester said there was no urgency to raise rates now, that she's open to seeing where the economy goes on rate moves, and that the Fed always left open the option on balance sheet reduction) and it appeared that the Fed had officially done an about-face and given the market what it wanted.
The bottom line here is simple, investors are no longer at odds with the Fed as Jay Powell's gaggle of central bankers appear to be on the same page with the message from both the stock and bond markets - that growth is slowing and there is no inflation in sight.
Now The Big Question Is...
Now that the Fed is out of the way, so to speak, the next issue investors have to deal with is the Trade War with China. And since the economic data for both countries is going the wrong direction, it makes sense that both sides would want to get a deal done - perhaps sooner rather than later.
The good news is we won't have to wait long on this subject as official talks begin today. Here's hoping that this episode of "Deal Or No Deal" is a winner.
Now let's turn to the weekly review of my favorite indicators and market models...
The State of the Big-Picture Market Models
I like to start each week with a review of the state of my favorite big-picture market models, which are designed to help me determine which team is in control of the primary trend.

View My Favorite Market Models Online
The Bottom Line:
-
Once again there important changes on the Primary Cycle board this week, this time to the upside. First, the Risk/Reward Model upticked to neutral from negative. Ditto for my "Desert Island" Model and the Environment model. Granted, the advances seen in the three models were far from robust. For example, the Environment Model reading is literally on the line between neutral and negative. But the bottom line here is that the board is far less negative than it has been recently.
This week's mean percentage score of my 6 favorite models improved to 40.3 from 36.5 (2 weeks ago: 41.9%, 3 weeks ago: 47.8%, 4 weeks ago: 53.6%) while the median rose to 50% from 44.0% (2 weeks ago: 44.2%, 3 weeks ago: 45%, 4 weeks ago: 55%).
The State of the Trend
Once I've reviewed the big picture, I then turn to the "state of the trend." These indicators are designed to give us a feel for the overall health of the current short- and intermediate-term trend models.
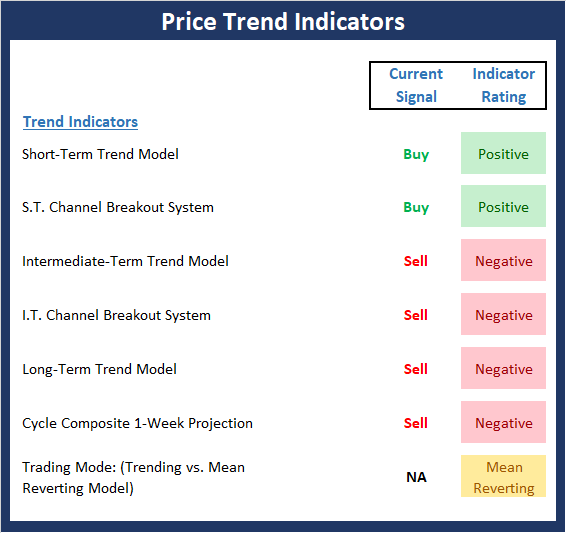
View Trend Indicator Board Online
The Bottom Line:
- Friday's joyride to the upside has the makings of a "rally continuation" move. The rally produced buy signals from our short-term trend and channel breakout trading systems. At this stage, the move should be viewed within the context of a dead cat bounce. However, should we see further improvement accompanied by overwhelmingly strong breadth, we may be able to argue that the bottom is in.
The State of Internal Momentum
Next up are the momentum indicators, which are designed to tell us whether there is any "oomph" behind the current trend.

View Momentum Indicator Board Online
The Bottom Line:
- Although the near-term trend has improved, the momentum board is unimpressed so far. The reason for the lack of green on the board here is that the majority of the indicators are intermediate-term oriented. And given that the rally is only 7 days old, the indicators have not improved enough to move out of negative territory.
The State of the "Trade"
We also focus each week on the "early warning" board, which is designed to indicate when traders might start to "go the other way" -- for a trade.

View Early Warning Indicator Board Online
The Bottom Line:
- The positive readings from the short-term overbought/sold and VIX indicators have been worked off and are now neutral. However, the good news is the intermediate-term indicators as well as the sentiment readings all continue to favor the bulls.
The State of the Macro Picture
Now let's move on to the market's "environmental factors" - the indicators designed to tell us the state of the big-picture market drivers including monetary conditions, the economy, inflation, and valuations.

View Environment Indicator Board Online
The Bottom Line:
- There are some modest shifts happening within the External Factors board. First, the monetary composite continues to improve as one can argue that there has been yet another false start to the big, bad, bond bear. Second, while both the economic and earnings models remain positive, the model readings have been slipping of late. And finally, although the valuation composite still sports a sell signal and a negative rating, valuation metrics are improving.
Thought For The Day:
Love me when I least deserve it, because that's when I really need it. - Swedish Proverb
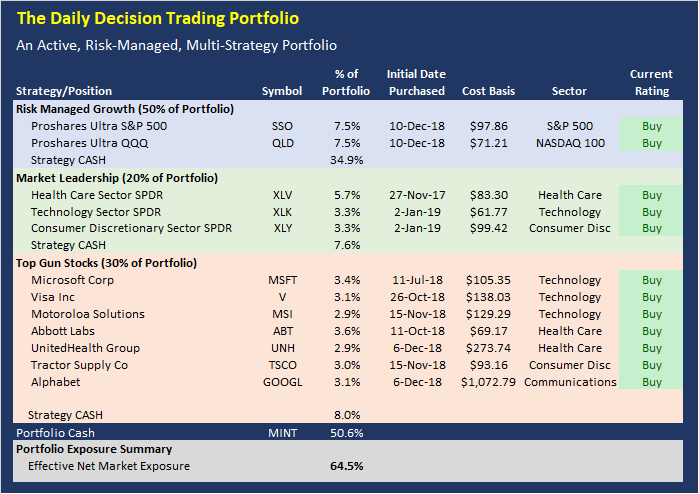
Portfolio Review
Here is the current positioning of the portfolio and our member ratings:
Effective Net Market Exposure Explained
The Effective Net Market Exposure is the "net long" position of the overall model portfolio after factoring in the impact of leveraged long positions such as SSO and QLD and/or short positions. Leveraged ETFs such as SSO are designed to deliver approximately twice the daily return of the underlying index. Thus, a 10% holding in the SSO equates to a 20% "net long" position to the portfolio.
Current Rating Explained
This is our rating for the day. The Current Rating tells you what action we would take if we did not currently hold the position. A "Buy" rating means we would be willing to purchase the position at current prices. A "Strong Buy" suggests this would be our first choice to buy. A "Hold" rating indicates we would not make new purchases at current levels. And a "Sell" rating indicates we will likely exit the position in the near-term.
Positions Can Change
Positions often change during the trading session. Remember that we will send a Trade Alert via SMS Text Message and/or Email BEFORE we ever make a move in the models.
Disclosure
At the time of publication, the editors hold long positions in the following securities mentioned:
SSO, QLD, XLV, XLK, XLY , MSFT, V, MSI, ABT, UNH, TSCO, GOOGL
- Note that positions may change at any time.
About the Portfolio:
The latest upgrade to the Daily Decision service went live on Monday, July 9. The new, state-of-the-art portfolio employs a modern, hedge fund style approach incorporating multiple methodologies, multiple strategies, and multiple time-frames. The portfolio is comprised of three parts:
- 50% Aggressive Risk-Managed Growth (up to 300% long)
- 20% Market Leaders
- 30% Top Gun Stocks
The Aggressive Risk-Managed Growth portion is made up of five trading strategies and accounts for 50% of the portfolio. The Market Leadership portion makes up 20% of the portfolio. And the Top Guns Stocks portion (10 of our favorite stocks) will make up the final 30% of the portfolio.
All three of our strategies are run in a single Marketfy model - the model is currently labeled as the LEADERS model. The goal is to make the service simpler to follow by putting everything in one place.
Wishing You All The Best in Your Investing Endeavors!
The Front Range Trading Team
NOT INVESTMENT ADVICE. The analysis and information in this report and on our website is for informational purposes only. No part of the material presented in this report or on our websites is intended as an investment recommendation or investment advice. Neither the information nor any opinion expressed nor any Portfolio constitutes a solicitation to purchase or sell securities or any investment program. The opinions and forecasts expressed are those of the editors and may not actually come to pass. The opinions and viewpoints regarding the future of the markets should not be construed as recommendations of any specific security nor specific investment advice. Investors should always consult an investment professional before making any investment.
Recent free content from FrontRange Trading Co.
-
 The Lines In The Sand Are Clear
— 9/16/20
The Lines In The Sand Are Clear
— 9/16/20
-
The Question of the Day
— 8/04/20
-
Portfolio Update: 1.23.20
— 1/23/20
-
State of the Markets: Modeling 2020 Expectations (Just For Fun)
— 1/13/20
-
Current Holdings for ALL-NEW 2020 Daily Decision Model Portfolio
— 1/03/20
