

Will Real Estate Be The Big Winner in Q1?
Coming into 2015 one of my favorite Ideas has been in Real Estate Investment Trusts. I even wrote a piece back in early December titled, “What’s There Not To Like About REITs?”. The idea has been that as interest rates stay low, money will continue to flow into higher yielding stocks at a faster rate than the lower yielding sectors. This is likely the reason why REITs doubled the performance of the S&P500 last year. I’m in the camp that this trend in outperformance continues as REITs relative to S&Ps break out to 18-month highs this week and on absolute basis are currently sitting at over 7-year highs. However, recent developments are pointing to the actual builders themselves now becoming leaders as well.
The first chart we are looking at is the US Home Construction Exchange Traded Fund $ITB bumping up against overhead supply for what is now arguably the fourth time since last year. To me, the more times that a level is tested, the higher the likelihood that it breaks out. All signs are pointing to new highs in this space and we want to be buyers of that breakout:
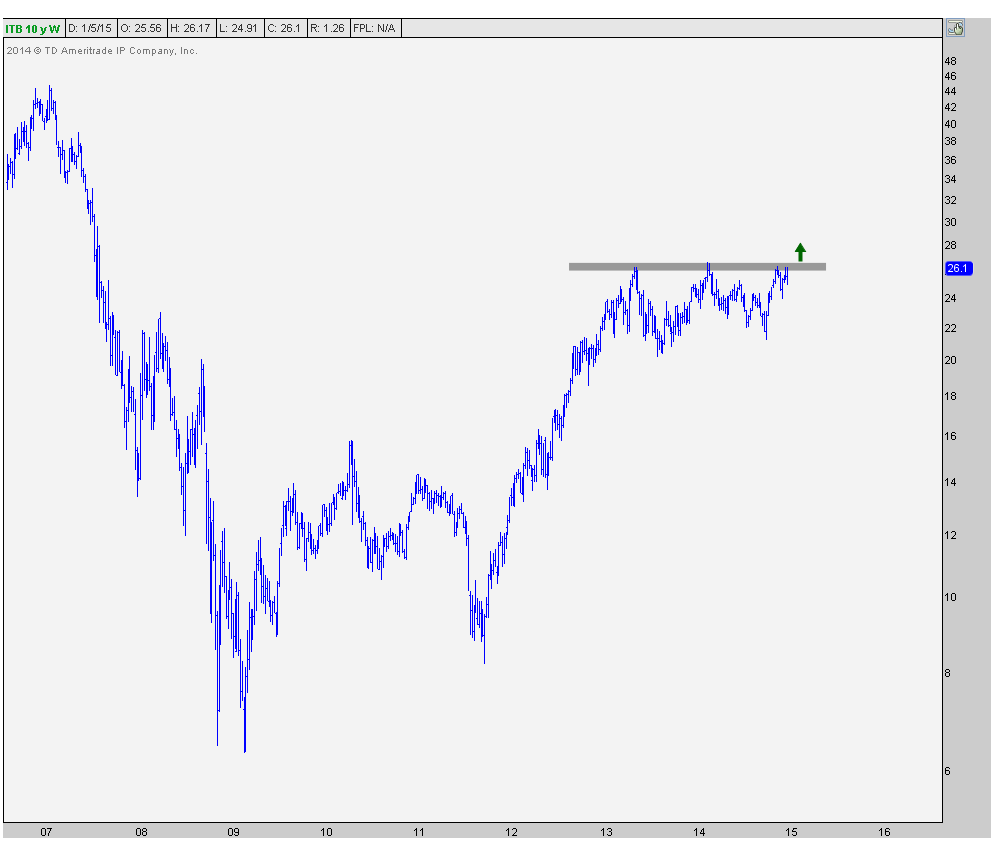
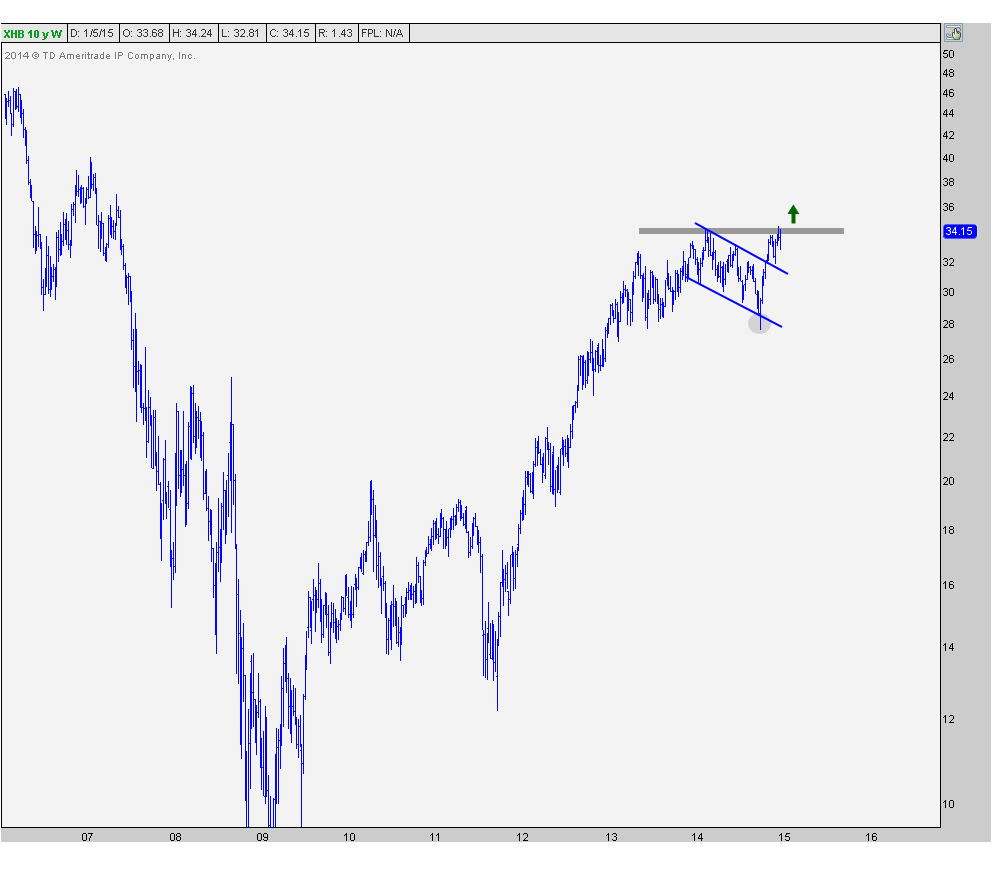
This ETF consists of a basket of home builders like D.R. Horton, Lennar, Pulte and Toll Brothers. ITB is an exchange traded fund put together by iShares. But SPDR also has a an ETF that they call “Homebuilders”, but$XHB is much more diversified in terms of its holdings. No one position represents more than 3.4% of the entire basket, as opposed to ITB where the top 4 positions represent close to 40% of the ETF. In addition, the SPDR version XHB’s top holdings include Lumber Liquidators, a home improvement company, and Aaron’s Inc., a specialty retailer. So they include positions that don’t even “build homes”. But either way you slice it, XHB has consolidated in similar fashion to ITB over the past two years and is also breakout out early in 2015:
The chart that I think is the most impressive of this group has to be the relative chart between the iShares Home Construction ETF $ITB compared with the S&P500. Here is a a daily line chart representing the ITB/SPY ratio. This trade represents a long position in ITB and an equivalent nominal amount of an SPY short position:
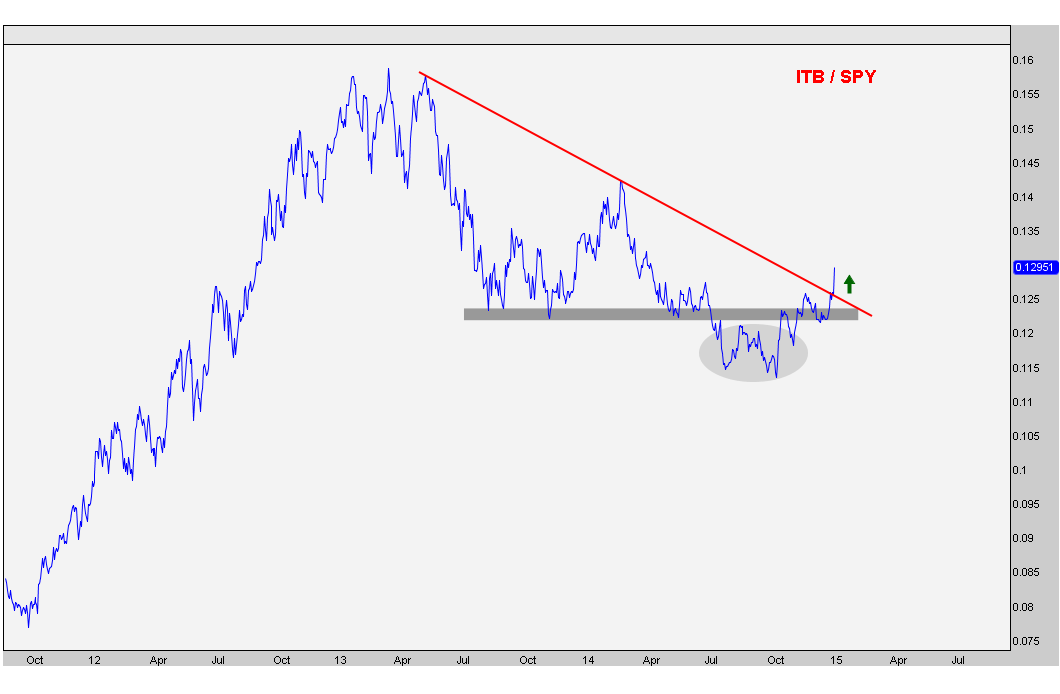
Notice how this not only put in a failed breakdown during the July through October period last year, but is now breaking out to the upside of an 18-month downtrend line. From failed moves tend to come fast ones in the opposite direction, and in this case I believe this will lead to more outperformance out of Home Construction stocks going forward.
Once the second quarter begins in April, we could be looking back at these developments as the beginning of a major move in this space to dominate Q1 of 2015.
What do you guys think?
***
Members of Eagle Bay Solutions receive updates on these charts weekly with annotations and commentary.REGISTER HERE to receive our US Sector reports that also include 30 more sectors and sub-sectors on multiple timeframes.
Recent free content from J.C. Parets
-
 Miami This Week For The Finance Festival
— 11/04/15
Miami This Week For The Finance Festival
— 11/04/15
-
The Nasdaq Flirts With All-Time Highs
— 11/02/15
-
 Video: Technical Analysis Webinar by JC Parets
— 9/29/15
Video: Technical Analysis Webinar by JC Parets
— 9/29/15
-
Overhead Supply in Healthcare & Biotech
— 9/22/15
-
Thinking Out Loud Heading Into Q4
— 9/22/15
-
{[comment.author.username]} {[comment.author.username]} — Marketfy Staff — Maven — Member

- 1 Campus Martius, Suite #200Detroit, MI 48226
- +1 877 440 9464