

BREXIT Means Yet Another Trip Through the Range
Good morning and welcome back to the circus. To be sure, the level of macro uncertainty clearly spiked on Friday and the prognostications of the BREXIT vote are coming fast and furious. But the bottom line is the stock market was fooled on Friday and traders (and their margin clerks) took action quickly. The question, of course, is if Friday's fireworks will continue - or - were merely an overreaction. Time will tell.
So, without further ado, let's move on to our weekly review of the state of the market and our major market indicators/models.
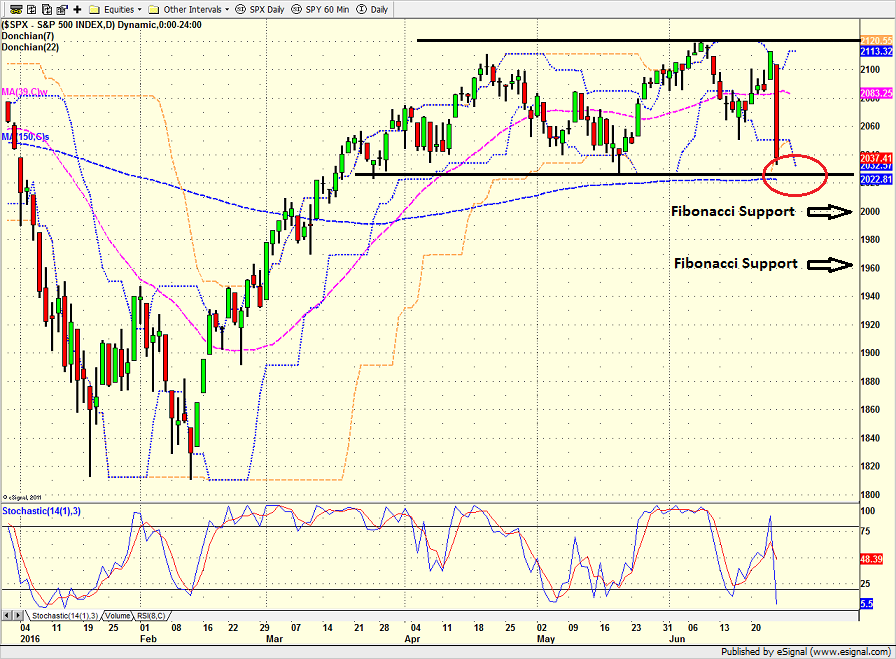
As usual, the first stop is a review of the price/trend of the market. Here's my take...
- The short-term trend is now down (feel free to insert "duh" emoticon here).
- Q: Would the level of Friday's decline have been as large if it hadn't happened on a Summer Friday?
- Even from a short-term perspective, major indices still in trading range.
- Key test for both teams will come at S&P 2020.
- For chart geeks, the key Fibonacci retracement levels (i.e. short-term support) are at 2000 and 1965
- A meaningful break on a closing basis of 2020 will likely trigger test of retracement levels.
- A move to 1965 would represent a pullback of -7.3%.
- Recent declines (August and Jan/Feb) have exceeded 12%.
S&P 500 - Daily 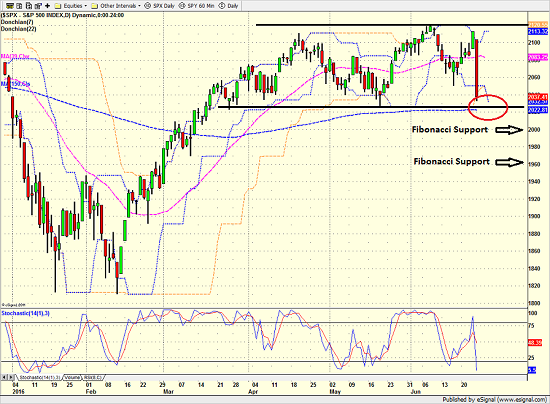
View Larger Image
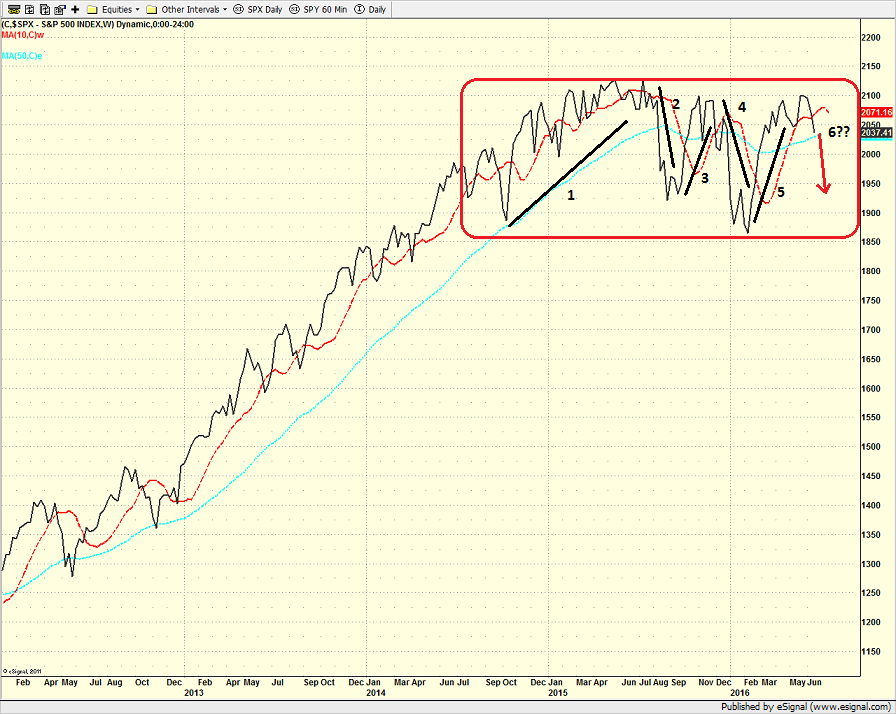
From a longer-term perspective (e.g. looking at a weekly chart of the S&P 500)...
- While it may be surprising to those short-term traders, nothing really changed Friday from longer-term chart perspective.
- Looks like another trip through the trading range may be on tap.
- As shown on the chart below, this would mark the 6th trip through the range.
- Bottom Line: A break below 2000 is meaningful from a weekly chart basis.
S&P 500 - Weekly 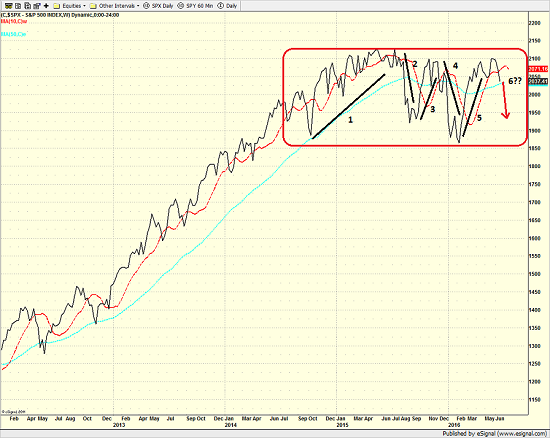
View Larger Image
Here's the view of the "state of the trend" from our indicator panel.
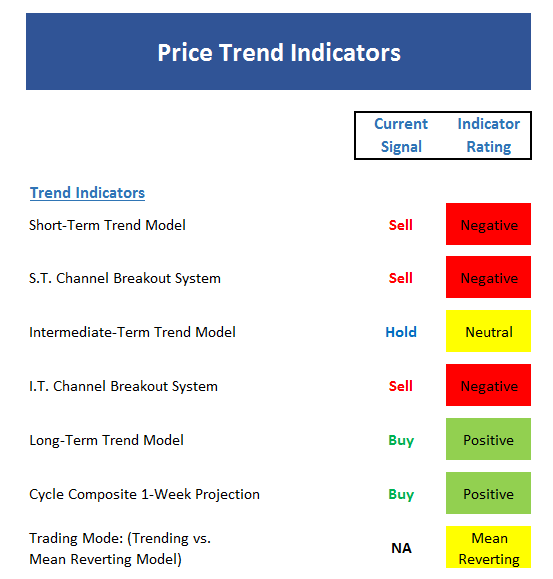
- The short-term trend model is now slightly negative.
- But, the intermediate-term trend models remain neutral.
- The S&P has fallen enough for the channel breakout system to be near an intermediate-term sell signal.
- However, with stocks in a mean-reverting mode, a modest reversal would trigger a buy signal in my channel system.
- The cycle composite points up for next couple of weeks.
Next up is the momentum indicator board...
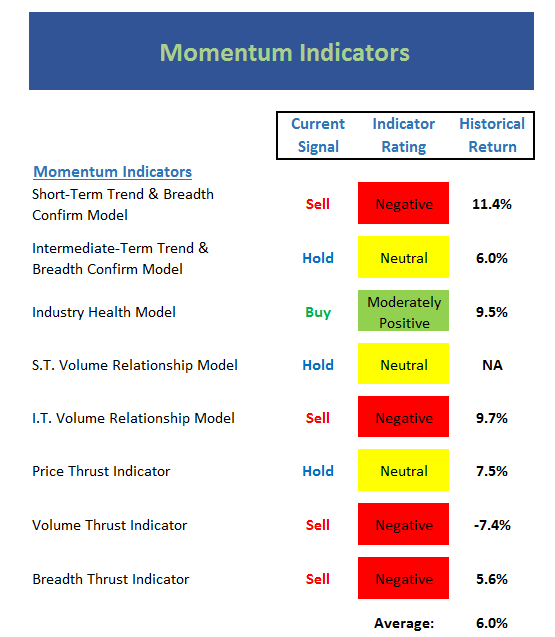
- The short-term trend & breadth confirm system is now negative (no surprise here).
- Since 2007, a negative reading on this indicator has been an oversold buy signal (have I mentioned that the character of the market has changed?)
- Intermediate-term T&B model only neutral.
- No real damage to the Industry Health Model (means that majority of the 104 subindustry groups remain technically healthy).
- Intermediate-term volume relationship model remains negative.
- The volume relationship models have done a good job in reminding us that all has not been well in this market from an internal standpoint.
Next up is the "early warning" board, which is designed to indicate when traders may start to "go the other way" for a trade.
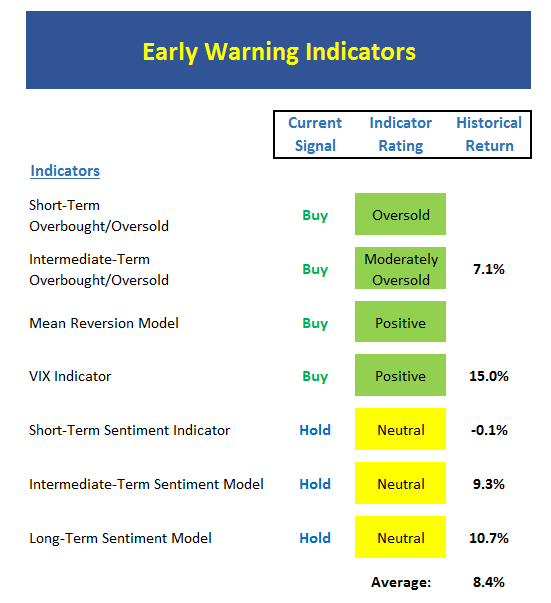
- Stocks oversold from short-term perspective.
- Stocks moderately oversold from intermerdiate-term perspective.
- Remember that stocks can stay overbought/sold for extended periods of time during meaningful trends.
- Mean reversion model gave buy signal this week - unfortunately this was an early signal.
- VIX model is close to flashing a new buy signal (however, it too flashed an early/wrong buy signal).
- Sentiment models are now neutral and not yet at extreme levels.
Now let's move on to the market's "external factors" - the indicators designed to tell us the state of the big-picture market drivers including monetary conditions, the economy, inflation, and valuations.
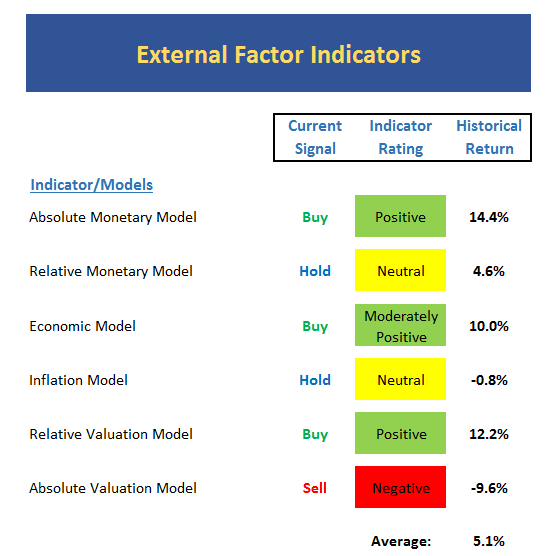
- Absolute monetary model back to positive due to yields diving.
- Weekly close for yield on 10-year is lowest since November 2012.
- No change to economic models this week.
- Internal component of inflation model did uptick (meaning inflation expectations rose slightly).
Finally, let's turn to our favorite big-picture market models, which are designed to tell us which team is in control of the prevailing major trend.
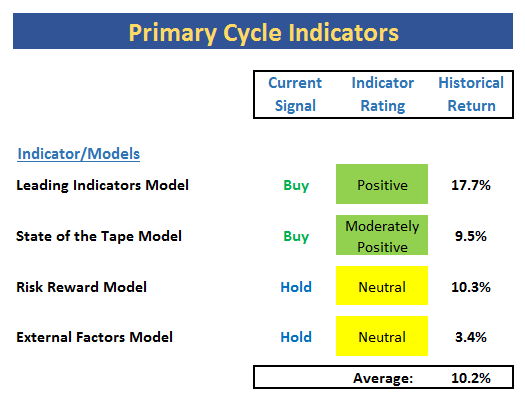
- Another one bites the dust... The External Factors Model went neutral early last week.
- The risk/reward continues to wave yellow flag and has done fine job of "calling" the overall environment this year.
- Historical returns for this board remain at long-term average levels.
- With only one of the indicators on this board solidly positive, the takeaway should be obvious - this is not a strong environment.
The Takeaway...
The market freaked out again on Friday. The question, of course, is if there will be follow-through. Thus, Europe will lead the way forward for a while. It is worth noting that the level of macro uncertainty increased on Friday. This may become yet another overhang for bull camp. In short, volatility should remain elevated in the near-term. And as I've said a time or twenty this year, we continue to believe that the dips such as this one should be bought - once the emotional trading subsides, that is.
Current Market Drivers
We strive to identify the driving forces behind the market action on a daily basis. The thinking is that if we can both identify and understand why stocks are doing what they are doing on a short-term basis; we are not likely to be surprised/blind-sided by a big move. Listed below are what we believe to be the driving forces of the current market (Listed in order of importance).
1. The Impact of the "Brexit"
2. The State of U.S. Economic Growth
3. The State of Fed Policy
4. The State of the Stock Market Valuations
Thought For The Day:
One dog barks at something. And a hundred dogs bark at the sound. - Chinese Proverb
Here's wishing you green screens and all the best for a great day,

David D. Moenning
Founder: Heritage Capital Research
Chief Investment Officer: Sowell Management Services
Looking for More on the State of the Markets?
!function(d,s,id){var js,fjs=d.getElementsByTagName(s)[0],p=/^http:/.test(d.location)?'http':'https';if(!d.getElementById(id)){js=d.createElement(s);js.id=id;js.src=p+'://platform.twitter.com/widgets.js';fjs.parentNode.insertBefore(js,fjs);}}(document, 'script', 'twitter-wjs');Disclosures
The opinions and forecasts expressed herein are those of Mr. David Moenning and may not actually come to pass. Mr. Moenning's opinions and viewpoints regarding the future of the markets should not be construed as recommendations. The analysis and information in this report is for informational purposes only. No part of the material presented in this report is intended as an investment recommendation or investment advice. Neither the information nor any opinion expressed constitutes a solicitation to purchase or sell securities or any investment program.
Any investment decisions must in all cases be made by the reader or by his or her investment adviser. Do NOT ever purchase any security without doing sufficient research. There is no guarantee that the investment objectives outlined will actually come to pass. All opinions expressed herein are subject to change without notice. Neither the editor, employees, nor any of their affiliates shall have any liability for any loss sustained by anyone who has relied on the information provided.
The analysis provided is based on both technical and fundamental research and is provided "as is" without warranty of any kind, either expressed or implied. Although the information contained is derived from sources which are believed to be reliable, they cannot be guaranteed.
David D. Moenning is an investment adviser representative of Sowell Management Services, a registered investment advisor. For a complete description of investment risks, fees and services, review the firm brochure (ADV Part 2) which is available by contacting Sowell. Sowell is not registered as a broker-dealer.
Employees and affiliates of Sowell may at times have positions in the securities referred to and may make purchases or sales of these securities while publications are in circulation. Positions may change at any time.
Investments in equities carry an inherent element of risk including the potential for significant loss of principal. Past performance is not an indication of future results.
Advisory services are offered through Sowell Management Services.
Recent free content from FrontRange Trading Co.
-
 Is The Bull Argument Too Easy These Days?
— 8/31/20
Is The Bull Argument Too Easy These Days?
— 8/31/20
-
What Do The Cycles Say About 2020?
— 1/21/20
-
Modeling 2020 Expectations (Just For Fun)
— 1/13/20
-
Tips From Real-World Wendy Rhoades
— 5/06/19
-
The Best Recession Ever!
— 4/29/19
-
{[comment.author.username]} {[comment.author.username]} — Marketfy Staff — Maven — Member


- 1 Campus Martius, Suite #200Detroit, MI 48226
- +1 877 440 9464