

Beyond The Biotech Space - FedEx Corporation (NYSE: FDX)
FDX pushes higher
FDX had formed a clear resistance at $174 (red) over the last 2 months.
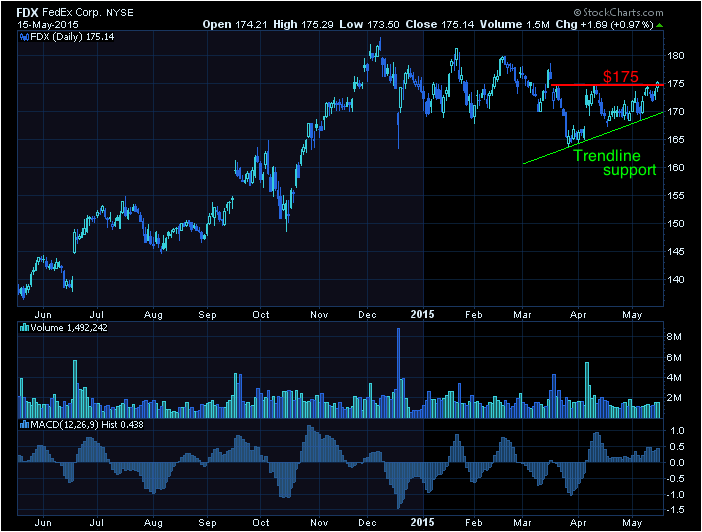
In addition, the stock has been climbing a short-term, trend line of support (green) since the end of March. These two levels combined had FDX stuck within a common chart pattern known as an ascending triangle. Eventually, the stock had to break one of those levels, and on Friday it broke above the resistance.
The Tale of the Tape:
FDX broke above its $175 resistance level. A long trade could be made at or near that level with a stop placed underneath it. A break back below the $175 level, and the trendline support, would be an opportunity to enter a short trade.
Before making any trading decision, decide which side of the trade you believe gives you the highest probability of success. Do you prefer the short side of the market, long side, or do you want to be in the market at all? If you haven’t thought about it, review the overall indices themselves. For example, take a look at the S&P 500. Is it trending higher or lower? Has it recently broken through a key resistance or support level? Making these decisions ahead of time will help you decide which side of the trade you believe gives you the best opportunities.
No matter what your strategy or when you decide to enter, always remember to use protective stops and you’ll be around for the next trade. Capital preservation is always key!
Good luck!
The Biotech Trader
@TraderBiotech
Recent free content from Christian Tharp, CMT
-
 Biotech Breakdown: Positive Signs Are Building (11/25/15)
— 11/25/15
Biotech Breakdown: Positive Signs Are Building (11/25/15)
— 11/25/15
-
Biotech Breakdown: Market Still Pulling Back (11/12/15)
— 11/12/15
-
Biotech Breakdown: Market Pullback Before New Highs (11/6/15)
— 11/06/15
-
Biotech Breakdown: Market Correction Over? (10/22/15)
— 10/23/15
-
Biotech Breakdown: Markets Up, Biotechs Finally Take Part (10/16/15)
— 10/16/15