

Beyond The Biotech Space - Paycom Software, Inc (NYSE: PAYC)
PAYC channels higher
PAYC has formed a relatively clear up-channel chart pattern over the last 8 months.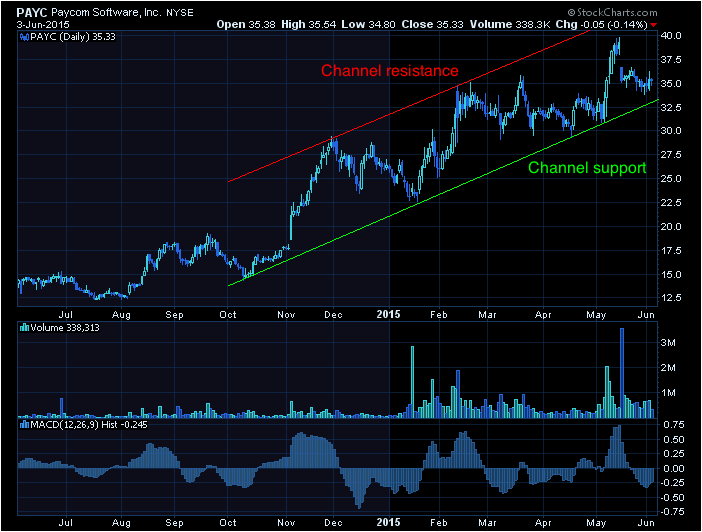
A channel is simply formed through the combination of a trend line support that runs parallel to a trend line resistance. When it comes to channels, remember that any (3) points can start the channel, but a 4th point or more confirms it. You can see that PAYC has several points of channel resistance (red) and support (green).
The Tale of the Tape:
PAYC has formed an up-channel. A long trade could be entered on a pullback down to the channel support, which currently sits near $33. Short opportunities would be on rallies up to channel resistance or on a break of channel support.
Before making any trading decision, decide which side of the trade you believe gives you the highest probability of success. Do you prefer the short side of the market, long side, or do you want to be in the market at all? If you haven’t thought about it, review the overall indices themselves. For example, take a look at the S&P 500. Is it trending higher or lower? Has it recently broken through a key resistance or support level? Making these decisions ahead of time will help you decide which side of the trade you believe gives you the best opportunities.
No matter what your strategy or when you decide to enter, always remember to use protective stops and you’ll be around for the next trade. Capital preservation is always key!
Good luck!
The Biotech Trader
@TraderBiotech
Recent free content from Christian Tharp, CMT
-
 Biotech Breakdown: Positive Signs Are Building (11/25/15)
— 11/25/15
Biotech Breakdown: Positive Signs Are Building (11/25/15)
— 11/25/15
-
Biotech Breakdown: Market Still Pulling Back (11/12/15)
— 11/12/15
-
Biotech Breakdown: Market Pullback Before New Highs (11/6/15)
— 11/06/15
-
Biotech Breakdown: Market Correction Over? (10/22/15)
— 10/23/15
-
Biotech Breakdown: Markets Up, Biotechs Finally Take Part (10/16/15)
— 10/16/15