The action in the stock market was the mirror image of Monday’s action. That day, a big morning rally was reversed in the afternoon...and the market gave back much of its gains by the end of the day. Yesterday, a late day bounce took back about 1/3 of the market’s losses by the end of the day. We’re seeing some upside follow-through from that late-day pop this morning...as the S&P futures are trading 25 points higher as we write. In other words, even though there have been some negative news about the newest wave of the coronavirus as we’ve moved through the week, it looks like the news from PFE at the beginning of the week will give us another positive week for the stock market.
The volume was pretty low yesterday, so if you look at that indicator, it tells us that there wasn’t a lot of selling pressure yesterday...even when the market was on its lows. However, we do need to point out that the breadth was quite negative. It was more than 7 to 1 negative for the S&P 500 and more than 5 to 1 negative for the NYSE Composite Index......The lack of volume tells us that the decline yesterday had more to do with a lack of buyers than a big influx of sellers, but we’ll definitely want to keep an eye on the breadth over the coming days. If it continues to be relatively extreme, it will be a mild warning signal.
Shifting gears a bit, with Elon Musk in the news again today, we thought it would be a good time to look at the chart of Tesla. (For those who haven’t heard, Mr. Musk says that he might have Covid-19, but he doesn’t know for sure. He’s had two positive tests and two negative ones...so he’s calling the tests “bogus.”)
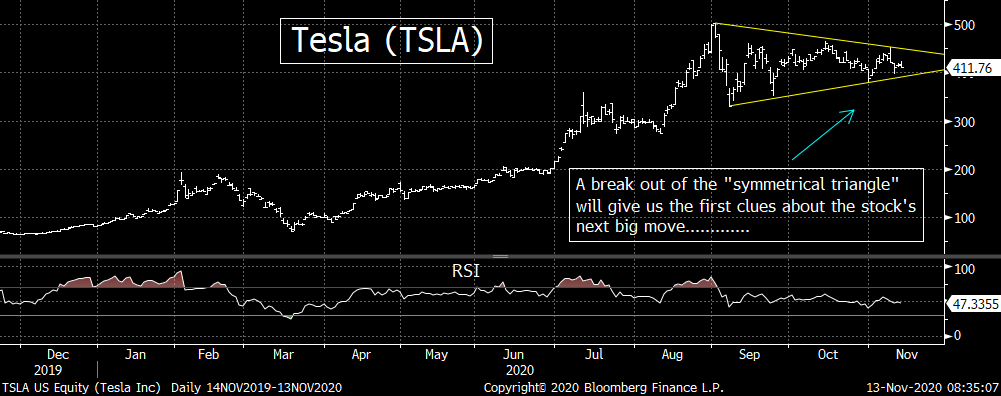
Anyway, there is a reason we have not talked about the chart of TSLA in a while. Very simply, the stock hasn’t done all that much!....It has bounced around in a pretty wide range for a couple of months now...but that range has been narrowing. Therefore, it is forming a “symmetrical triangle” pattern...and thus a break out of that pattern would give us a hint of the next big move for TSLA. (First chart below.)
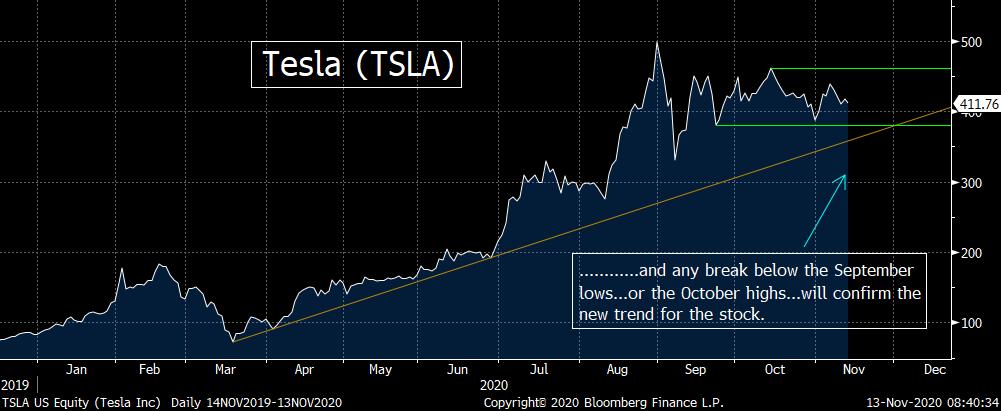
However, we’ll still need a further move...after it breaks out of that pattern...to give us confirmation about the direction of TSLA’s next big move. If it breaks the “symmetrical triangle” pattern to the downside, we’ll be watching the $380 level. That was the late September lows...and where the trend-line from March will come-in by very early December. Thus a break below that level would signal some meaningful problems for the stock........If the break of the triangle pattern is to the upside, we’ll be watching the October highs of $360. That will give it a nice “higher-high” and confirm a breakout of the triangle pattern to the upside.
The focus for the broad stock market has moved away from TSLA recently, but if it starts to move in a substantial way in one direction or the other before the end of the year, it could/should become a good indicator for the broad market once again. Therefore, there is no question that investors should be watching the above-mentioned levels for this stock over the coming weeks.
Matthew J. Maley
Managing Director
Chief Market Strategist
Miller Tabak + Co., LLC
Founder, The Maley Report
TheMaleyReport.com
275 Grove St. Suite 2-400
Newton, MA 02466
617-663-5381
Although the information contained in this report (not including disclosures contained herein) has been obtained from sources we believe to be reliable, the accuracy and completeness of such information and the opinions expressed herein cannot be guaranteed. This report is for informational purposes only and under no circumstances is it to be construed as an offer to sell, or a solicitation to buy, any security. Any recommendation contained in this report may not be appropriate for all investors. Trading options is not suitable for all investors and may involve risk of loss. Additional information is available upon request or by contacting us at Miller Tabak + Co., LLC, 200 Park Ave. Suite 1700, New York, NY 10166.
Recent free content from Matt Maley
-
 THE WEEKLY TOP 10
— 10/23/22
-
 Morning Comment: Can the Treasury market actually give the stock market some relief soon?
— 10/21/22
-
 What Do 2022 and 1987 Have in Common?
— 10/19/22
-
 Morning Comment: Which is it? Is stimulus bullish or bearish for the stock market?
— 10/17/22
-
 Morning Comment: Peak Inflation is Becoming a Process Instead of a Turning Point
— 10/13/22
-
{[comment.author.username]} {[comment.author.username]} — Marketfy Staff — Maven — Member


