

Here’s Why Energy Will Outperform Going Forward
Last week all of the energy sectors that we follow simultaneously hit our downside targets. Subscribers to our research had been eyeing these downside targets for a long time and at this point we no longer see a reason to be short Energy, particularly on a relative basis. The sector ETFs that I am referring to are the S&P Energy Sector$XLE, Oil Services $OIH and Oil & Gas Exploration & Production $XOP. Going forward, I believe these sectors will outperform the overall U.S. stock market.
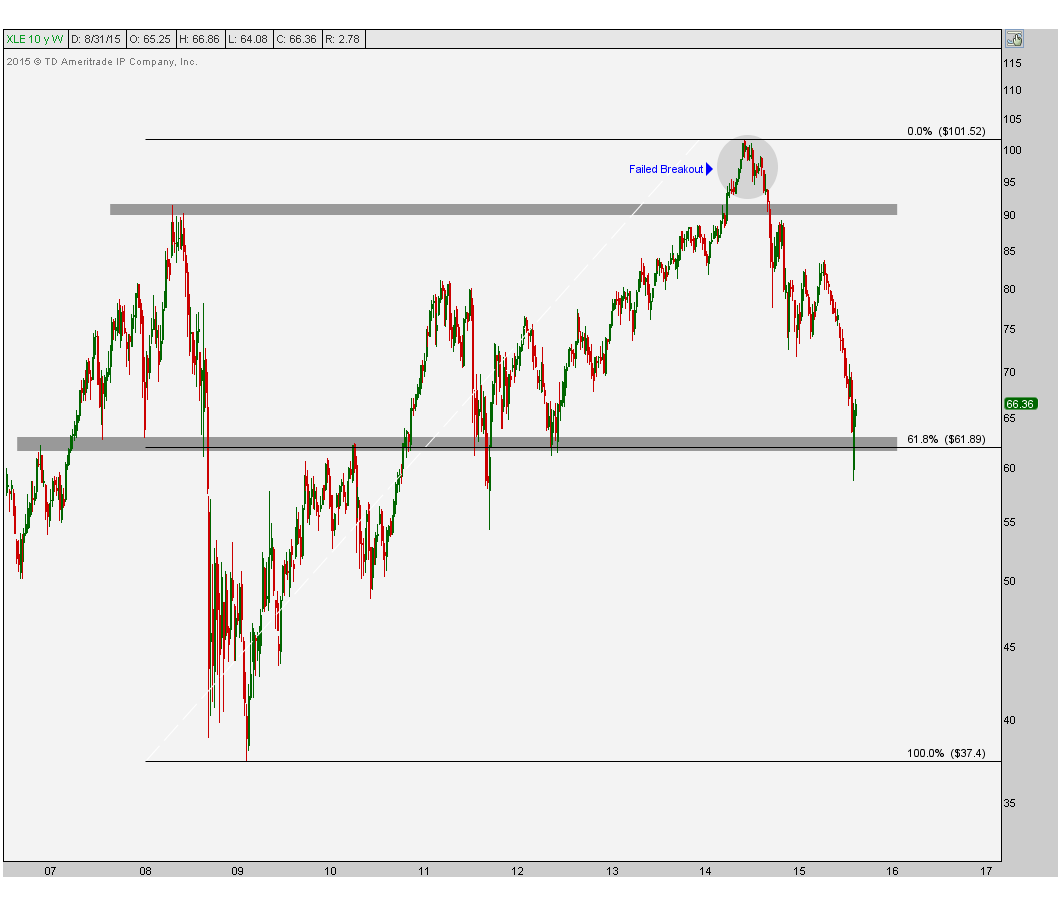
First, here is the Energy Sector $XLE which includes the big boys Exxon & Chevron. This is a weekly candlestick chart showing the consequences of that failed breakout last Summer. The old saying is that, “From failed moves come fast moves in the opposite direction”. It’s hard to find a better example out there. After a brief mean reversion earlier this year, prices broke down again and hit our downside target last week under $62. This level represents the 61.8% Fibonacci retracement of the entire 2009-2014 rally as well as support in 2012 that was resistance in 2010. Looking back further, this was also resistance and support in 2007 and where the crash really accelerated during 2008 financial crisis. There is a lot of market memory here:
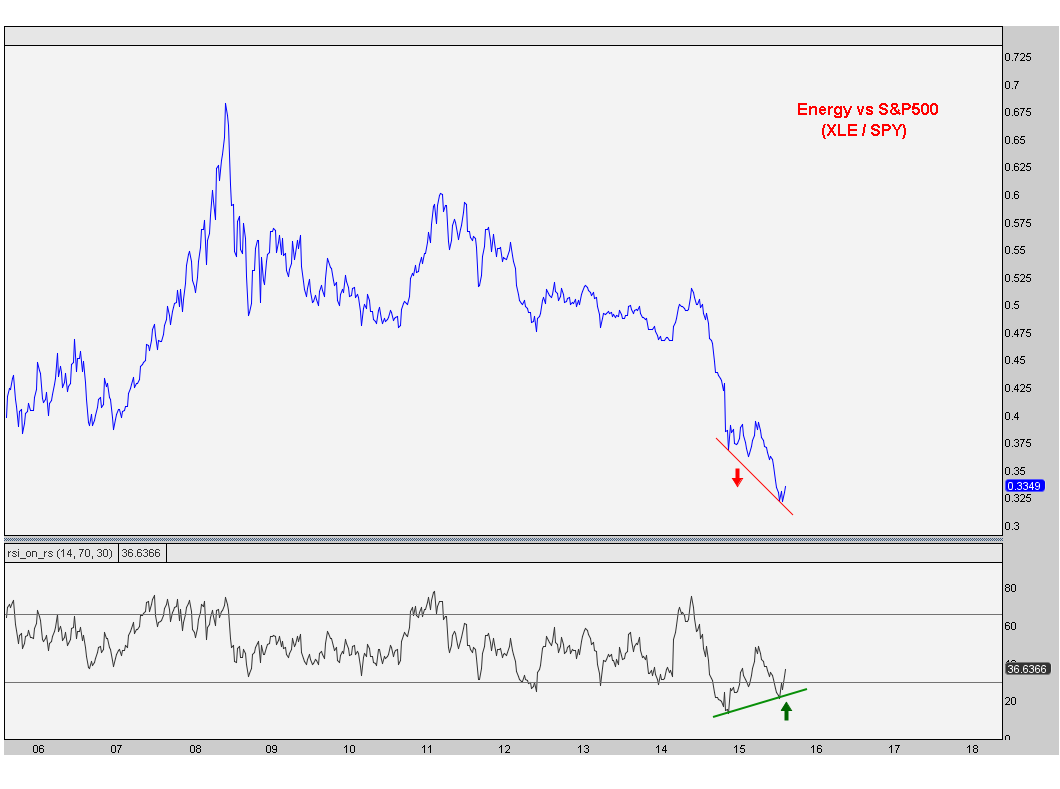
The purpose of this write-up is specifically to point out why we believe Energy will outperform the S&P500 going forward. For me, it’s when we see bullish momentum divergences on multiple timeframes that it gets my attention. In this case, we are using a 14-period RSI to measure momentum, and in both timeframes, we are seeing higher lows while prices put in their recent lows to finally reach our downside targets. Here is the weekly timeframe showing Energy relative to the S&P500:
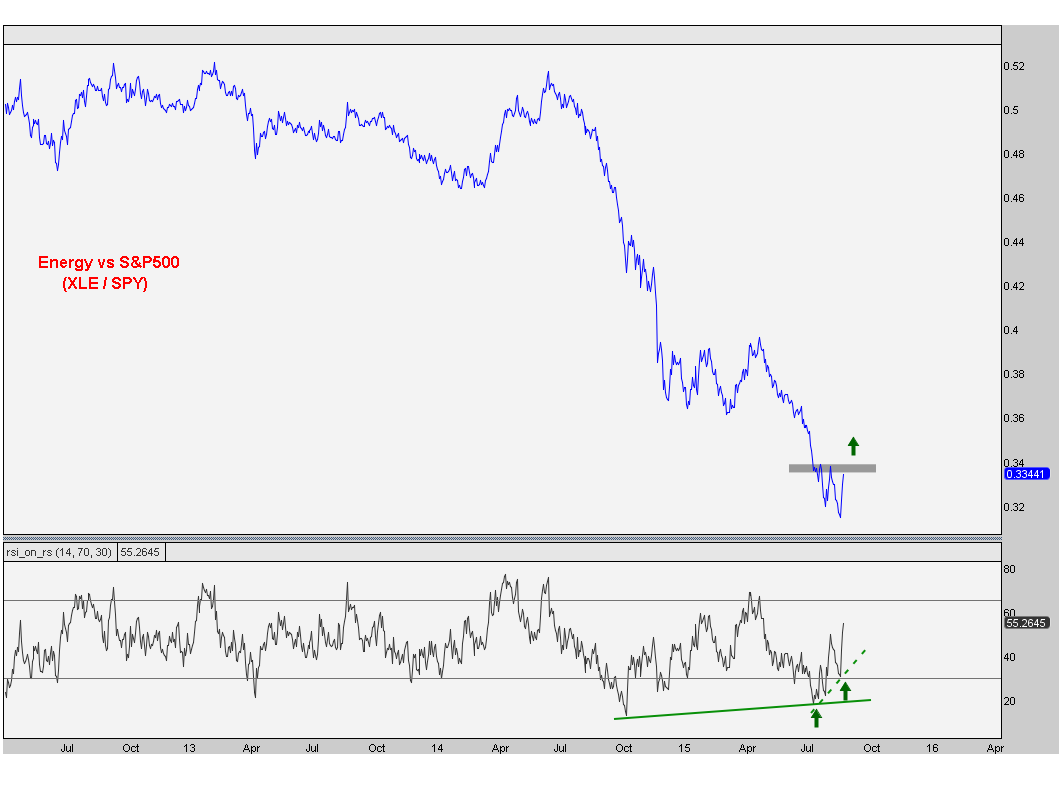
Here is the daily timeframe also showing a bullish momentum divergence:
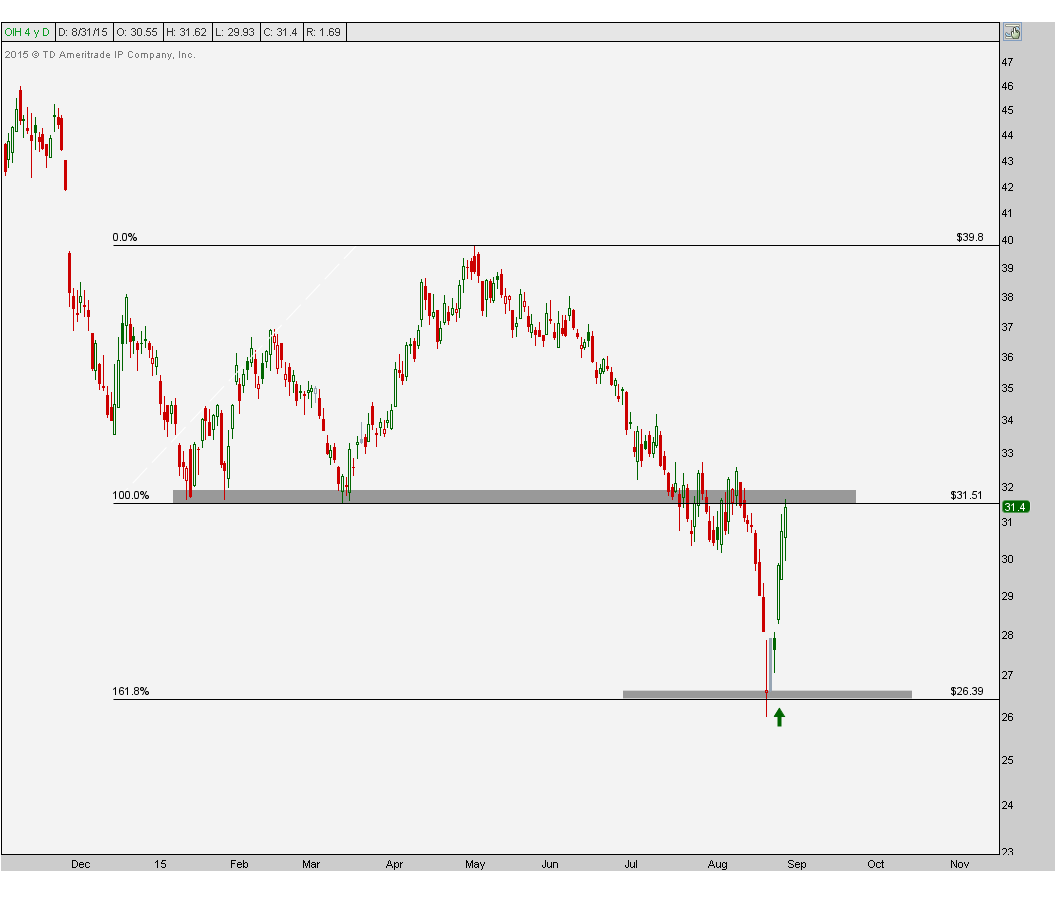
Next we are looking at the Oil Services names $OIH. These are the Schlumbergers, Halliburtons and Baker Hughes of the world. Once prices broke the early 2015 lows, our next downside target was near $26, which was based on the 161.8% Fibonacci extension of the counter-trend rally in March & April. This target was hit last week and prices ripped from there.
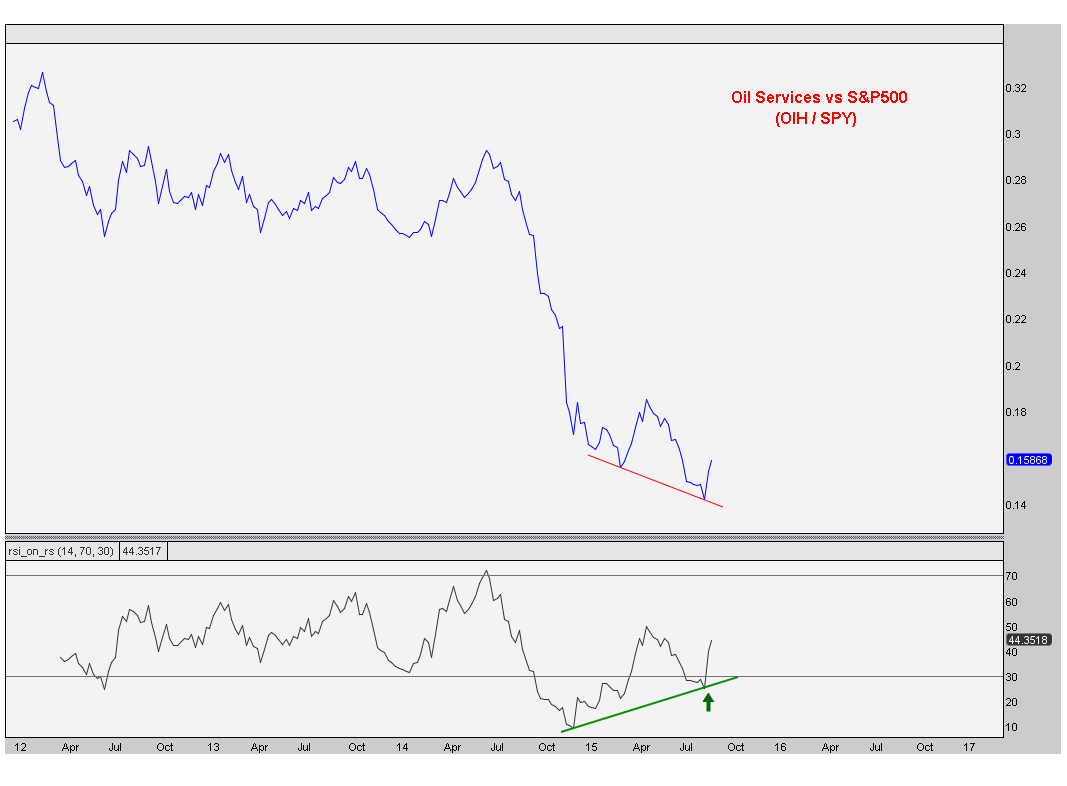
At this point, from an absolute perspective, if prices can get above and stay above those first quarter lows, I think that would be a big step going forward. But again, we are more focused on these guys relative to the overall market. Like the integrated names mentioned above, we are seeing bullish momentum divergences on multiple timeframes on these recent lows. Here is the weekly timeframe showing RSI putting in a higher low while price made a lower low:
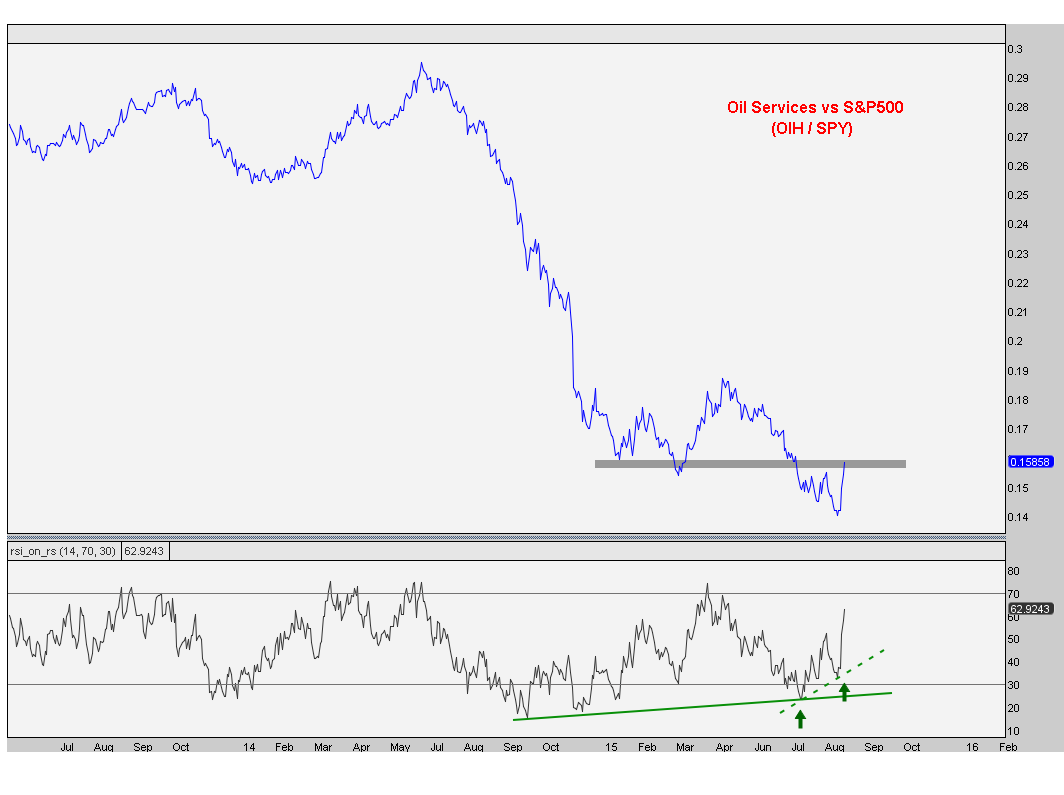
Here is the daily timeframe showing the same bullish divergence. I believe this will be the catalyst for further outperformance going forward, especially if we can get back above the first quarter relative lows:
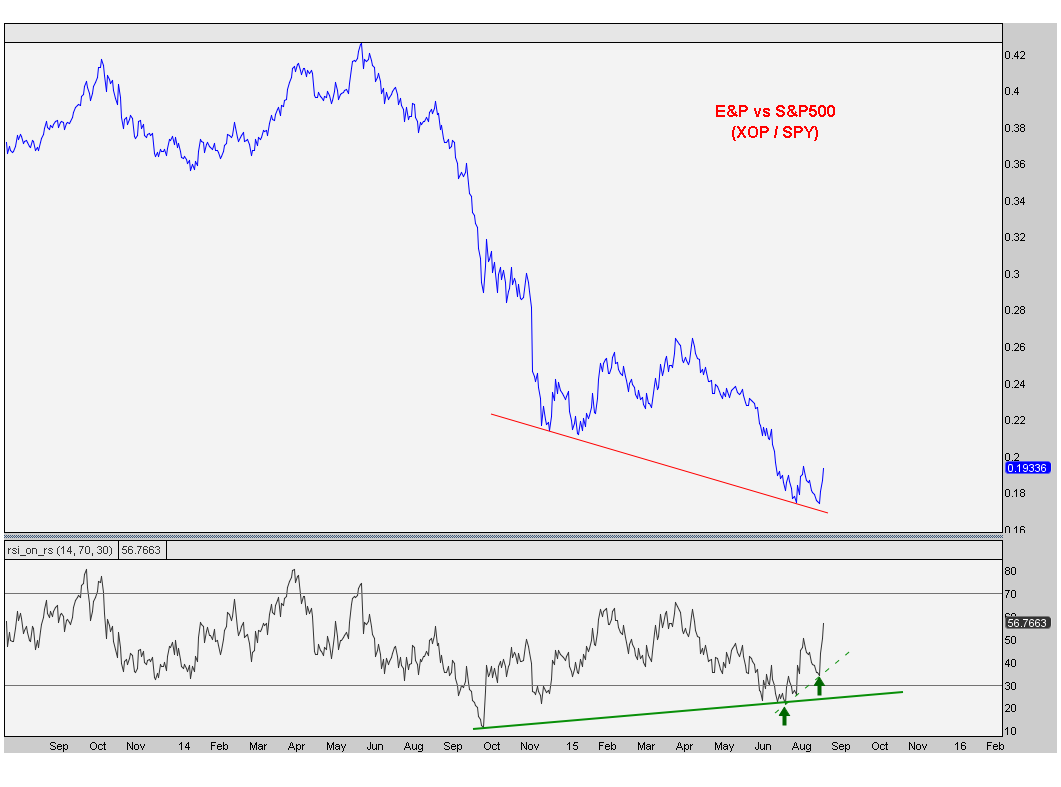
Finally, we’re taking a look at the E&P names. This group includes the explorers and producers like Tesoro, Valero, Marathon and Phillips 66. Just like the the Oil Service stocks, last week $XOP hit the 161.8% Fibonacci extension of the counter trend rally in the first quarter. From an absolute perspective, I think those former lows will be trouble just like in the Services names so getting above and staying above that would be a huge deal.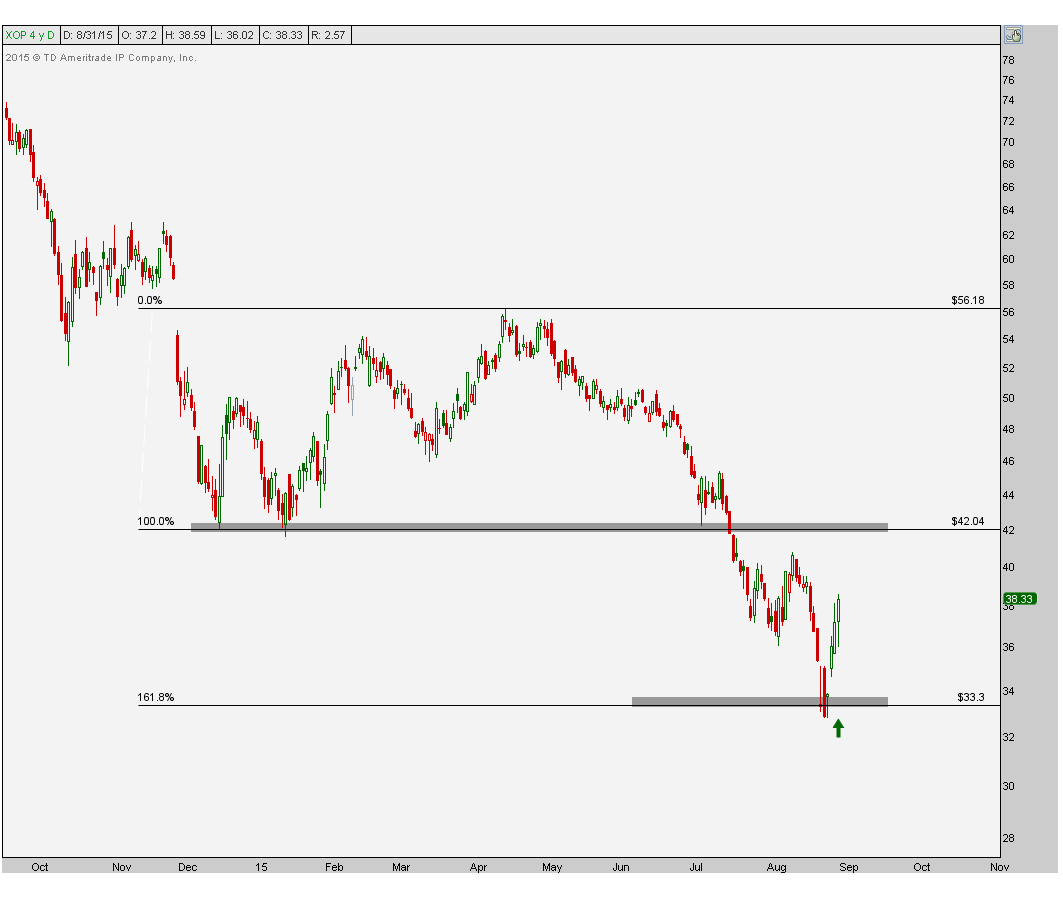 Again, we’re focused more on the relative outperformance going forward, so here is the weekly ratio of $XOP vs$SPY putting in new lows while momentum put in a higher low:
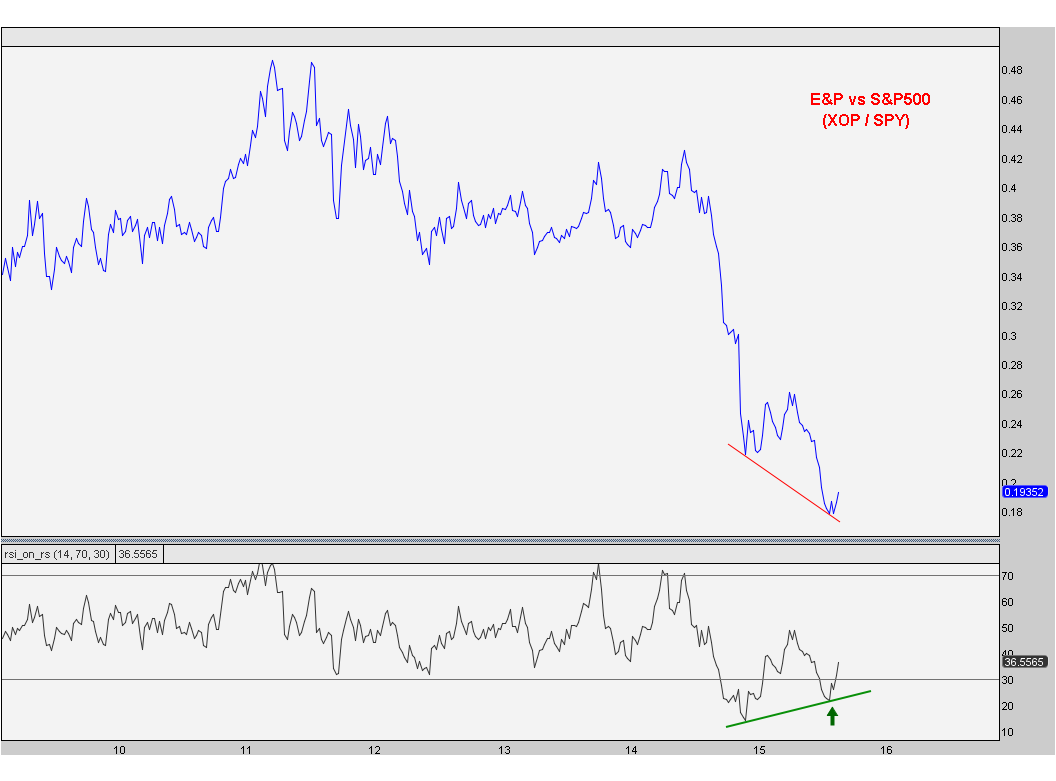
Here is the daily timeframe showing the same bullish divergences:
I think this is an interesting theme. It’s a combination of all of our downside objectives being achieved while momentum is showing bullish divergences on all timeframes in all 3 sectors. I think this can be the catalyst to get these going on a relative basis after struggling for so long. As far as the market itself is concerned, I’m still not a fan(See Here). I haven’t been (See Here) and things have gotten worse. There is just way too much overhead supply up here for me to get excited. So as far as U.S. Equities go, it’s looking for the outperformers to buy against market shorts that I’m mostly concerned with.
From a risk management perspective, these recent lows are big levels, particularly on a relative basis. If the recent relative lows are taken out and these momentum divergences fail, then all bets are off. This makes things easy on us because the levels are so well-defined. I believe this is the lower probability outcome, but we always want to keep an open mind. The weight-of-the-evidence, however, suggests that energy is where we want to be relative to the overall market going forward.
Sign up here to receive updates on all of these charts every week.
Recent free content from J.C. Parets
-
 Canadian Dollars Are About To Explode Higher
— 10/07/15
Canadian Dollars Are About To Explode Higher
— 10/07/15
-
Gold Looks Ready For Its Next Leg Lower
— 9/30/15
-
Find Your Edge: The Autumn 2015 AlphaShark Trading Symposium with a Presentation by J.C. Parets
— 9/25/15
-
Why Yen Is The Most Important Chart For US Stocks
— 9/17/15
-
Is Silver Ready For Its Next Leg Lower?
— 9/16/15
-
{[comment.author.username]} {[comment.author.username]} — Marketfy Staff — Maven — Member

- 1 Campus Martius, Suite #200Detroit, MI 48226
- +1 877 440 9464