

Why Yen Is The Most Important Chart For US Stocks
I get asked all the time, “JC, What are you looking at right now?”. My answer can go in many different directions from Wheat, to Soy Beans, to Treasury Bonds, to Caterpillar or Aussie Dollar. Depending on what’s going on, some charts stand out to me more than others. This is a puzzle that we’re constantly trying to build that is always changing. There is no holy grail. For me it’s about putting together all the clues. It’s not easy, I promise. But no one said it was. And if they did, they’re lying to you.
Today if you asked me what I think is most important, I’d have to say it’s the Yen. Right now we are looking at ridiculously high negative correlations between Yen and U.S. Stocks, particularly the S&P500. They are moving in opposite directions and the numbers speak for themselves with a correlation coefficient of over -0.9 over the past month as well as over the past quarter. If you want to know where stocks are headed, you want to watch the Yen.
Looking at the $USDJPY with the Yen as the denominator, it is very likely to move in the same direction as the S&P500 going forward. Here is a daily bar chart showing the failed breakout above 122 earlier this Summer that it was not able to remain above. Last month prices broke back down below this former resistance and simultaneously broke the uptrend lines from the lows in December/January. Any way you draw it up, this was a devastating breakdown:
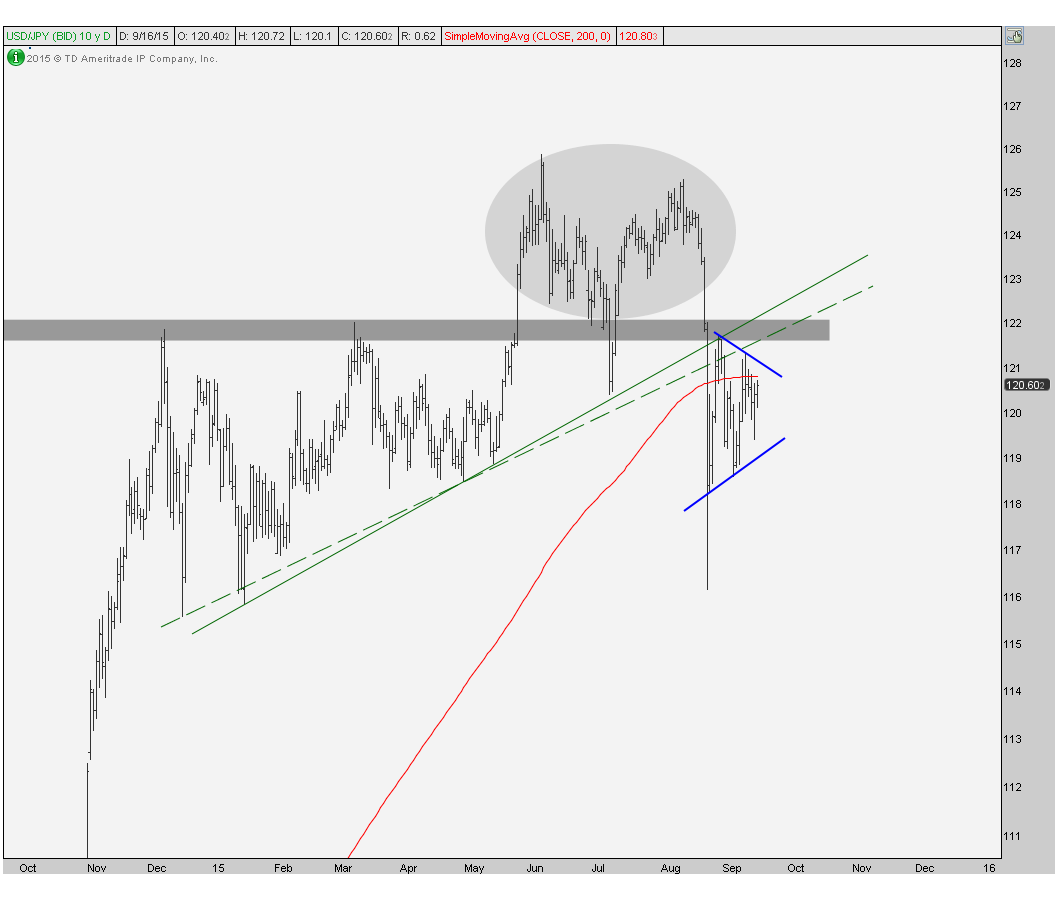
What’s happened since then is a consolidation of this breakdown defined by a series of lower highs and higher lows. This “pennant” like formation, as many technicians like refer to it, has developed just below all of these broken support levels. The question for me is, “In which direction will it resolve?”
The resolution will be telling for S&Ps because they have such a high negative correlation with Yen. In the case of$USDJPY, a positive correlation because Yen is the denominator in that cross. The problem I see is that these “pennants” tend to be continuation by nature, so in all likelihood, the break will be to the downside. In addition, with so much overhead supply from both the broken trendlines and former resistance from the past year or so, there is a lot of selling up there near 122 that needs to be absorbed before it can head higher. Momentum (not shown here) is also in a bearish range, which suggests it is no longer in an uptrend. Seasonally, we are currently in the worst time of the year for $USDJPY so that doesn’t help things much either.
I could be wrong, it’s happened before and it will happen again. But I have to say that the weight of the evidence is suggesting a downside resolution here which points to more selling in the S&P500. It would take $USDJPY to get above and remain above 122 in order to invalidate these bearish developments. I think it’s the lower probability outcome here, but in my opinion, one that is necessary for S&Ps to have a sustainable rally in the near future.
Also See: It’s The Yen, Stupid! (Sept 1, 2015)
***
Click Here to receive weekly updates on these charts as well as multi-timeframe analysis for the rest of the major currencies and 16 commodities futures contracts.
Recent free content from J.C. Parets
-
 Canadian Dollars Are About To Explode Higher
— 10/07/15
Canadian Dollars Are About To Explode Higher
— 10/07/15
-
Gold Looks Ready For Its Next Leg Lower
— 9/30/15
-
Find Your Edge: The Autumn 2015 AlphaShark Trading Symposium with a Presentation by J.C. Parets
— 9/25/15
-
Is Silver Ready For Its Next Leg Lower?
— 9/16/15
-
Here’s Why Energy Will Outperform Going Forward
— 8/31/15
-
{[comment.author.username]} {[comment.author.username]} — Marketfy Staff — Maven — Member

- 1 Campus Martius, Suite #200Detroit, MI 48226
- +1 877 440 9464