

Emerging Markets Are Still A Problem
As far as stocks go, it’s hard to find a worse area than Emerging Markets to have been in over the past few years. We’re talking about a group of countries whose stock markets do nothing but underperform the U.S. and most of the other developed nations. More recently, they’ve been crushed on an absolute basis over the past 6 months. Although our initial downside targets were hit in August, I would expect the overhead supply and downside pressure to continue to persist.
In Early August, we took a look at the MSCI Emerging Markets Index ETF suggesting that a downside break was imminent. Below is an updated weekly chart of Emerging Markets breaking down below the lower end of the two converging trendlines defining its consolidation over the past 6 years or so. In addition, prices broke that $37 area that had served as support since 2010. The more times that a level is tested, the higher the likelihood that it breaks. After several tests of support over the past 5 years, that level finally gave way. It was only a matter of time:
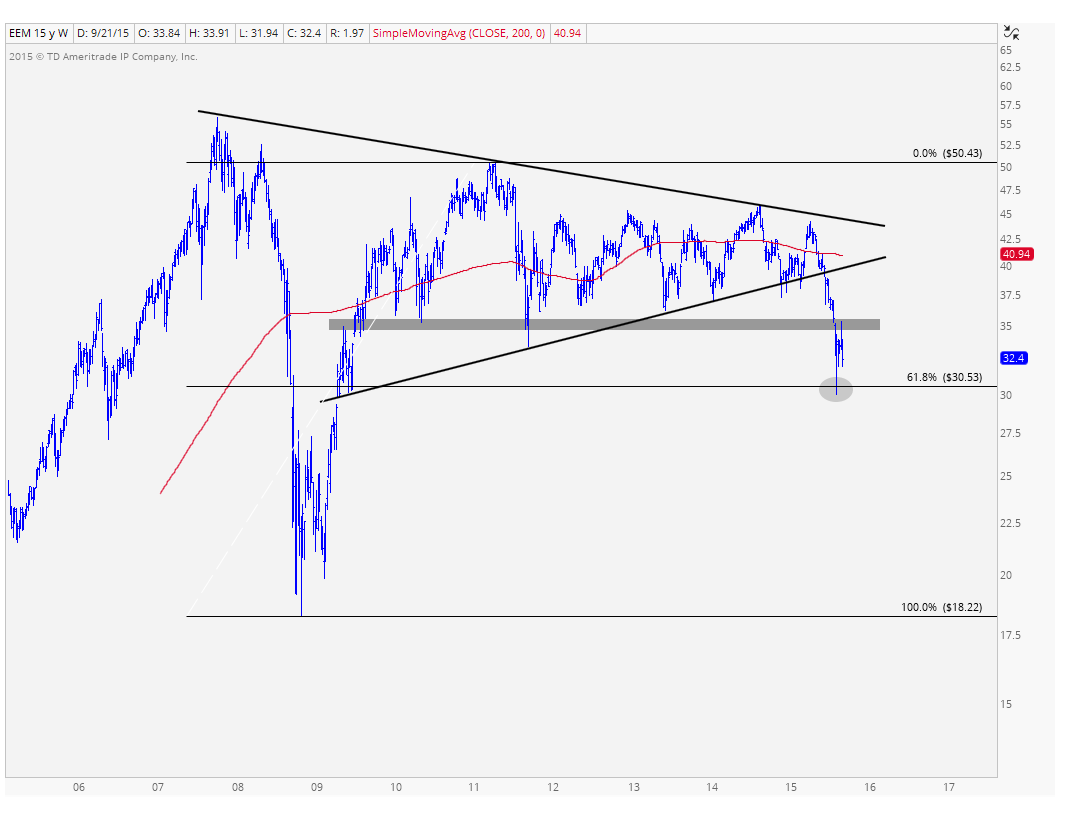
Notice how on that breakdown in August, prices were able to hold on to the 61.8% Fibonacci retracement of the entire 2008-2011 rally. Although finding support near that level was a positive, it’s what we have to worry about going forward that has me concerned. All of that former support that broke over the past few months is now overhead supply. This has been a common theme I’ve been pointing out here in the U.S. stock market. The same problem can be seen in Emerging Markets.
Here is a closer look at the breakdown in EM over the past couple of months. Look at all of that overhead supply that is now going to be a problem going forward. On any strength into that level near $37, the sellers are just sitting there waiting to sell to you. This is the, “Please just get me back to break even” crowd that is holding on to all of this supply. In my opinion, this is simply way too much supply to absorb in the near term and a sustainable rally in Emerging Markets is likely not happening any time soon. This is definitely a ‘sell strength’ market, particularly towards $37.
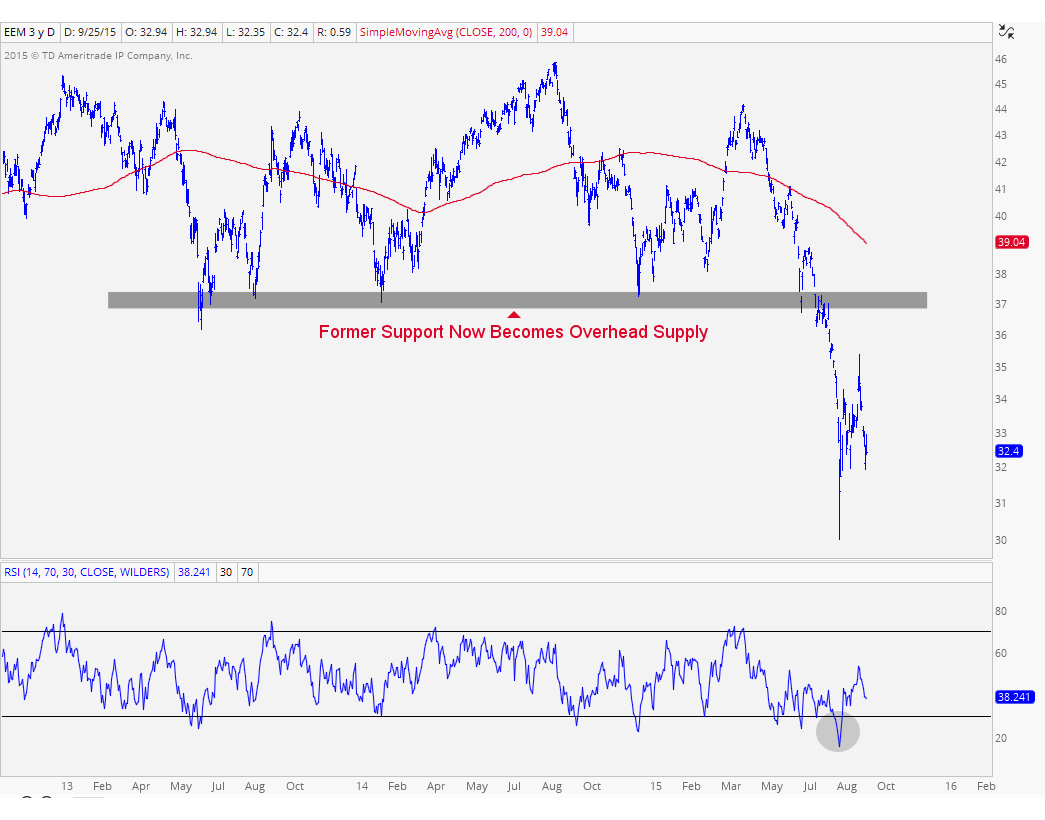
In this chart above I also included a 200 day simple moving average. When prices are trading below these downward sloping smoothing mechanisms, especially one as long as 200 days, we know the intermediate term trend is still down. In addition, look at momentum plotted down below. We are looking at a 14-day RSI hitting oversold conditions. This is characteristic of a downtrend and we haven’t even put any bullish divergences to suggest a sustainable rally could be coming.
I see nothing to like here and all signs are pointing to lower levels. The best way to take advantage of this, in my opinion, is to sell strength, particularly above $36 if we get up there. I’m not suggesting we’re getting a rally to those heights, but if we do, I think it’s a sell. The original shorting opportunity came a few months ago. So I think ‘sell strength’ is the dominant theme here that we want to focus on.
Related Posts:
Overhead Supply in the Dow Components
Overhead Supply in Healthcare & Biotechs
The Problem Now Is Overhead Supply
***
Click Here to receive weekly updates on each of these charts along with 80 charts of foreign stock market ETFs from all over the world, including Japan, China, Europe, Latin America and South Pacific.

Recent free content from J.C. Parets
-
{[comment.author.username]} {[comment.author.username]} — Marketfy Staff — Maven — Member

- 1 Campus Martius, Suite #200Detroit, MI 48226
- +1 877 440 9464