

The Weekly Top 10: Key Support Levels? Look at the 50 day moving averages.
Below you will find an abbreviated version of this week's edition of my financial newsletter, "The Maley Report." I give the full "Table of Contents"...and the "Short Versions" of our first 3 bullet points from this weekend (along with the charts that go with them). To see the full edition of this weekend's "Weekly Top 10" (with the rest of my "Short Version" and ALL of the points from the "Long Version" of our weekend piece)...AND to receive our daily comments about the markets...please click here to subscribe to "The Maley Report" (TheMaleyReport.com).
THE WEEKLY TOP 10
Table of Contents:
1) The markets are ripe for a pullback. Will the coronavirus be the catalyst?
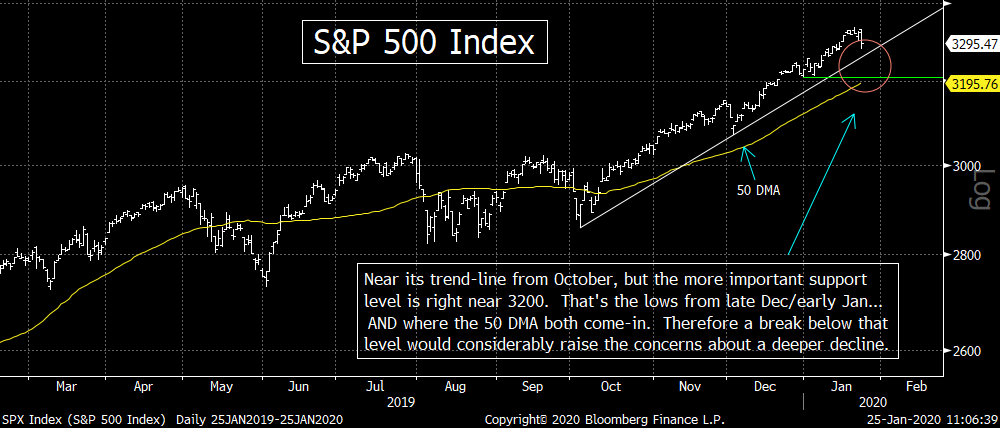
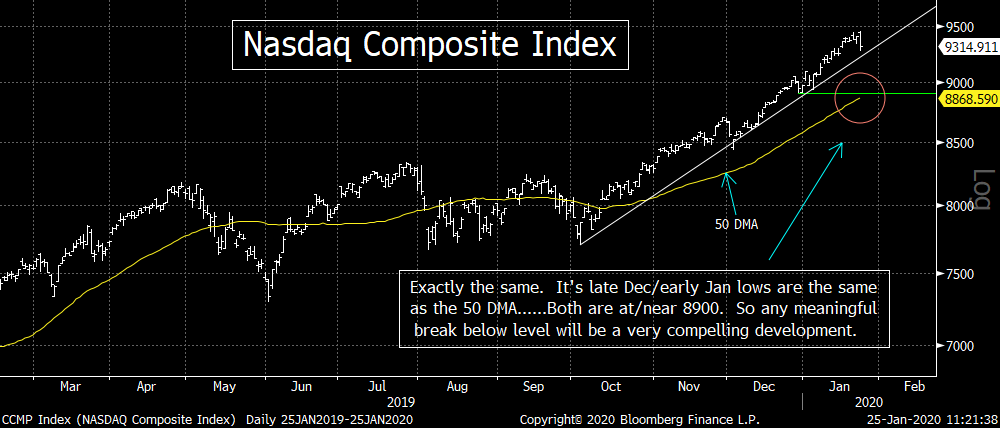
2) Key levels to watch on the S&P 500 and Nasdaq if the market falls further.
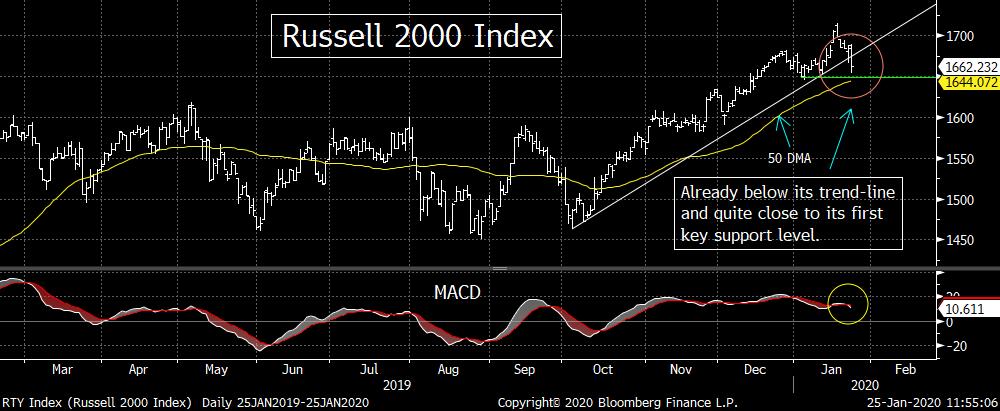
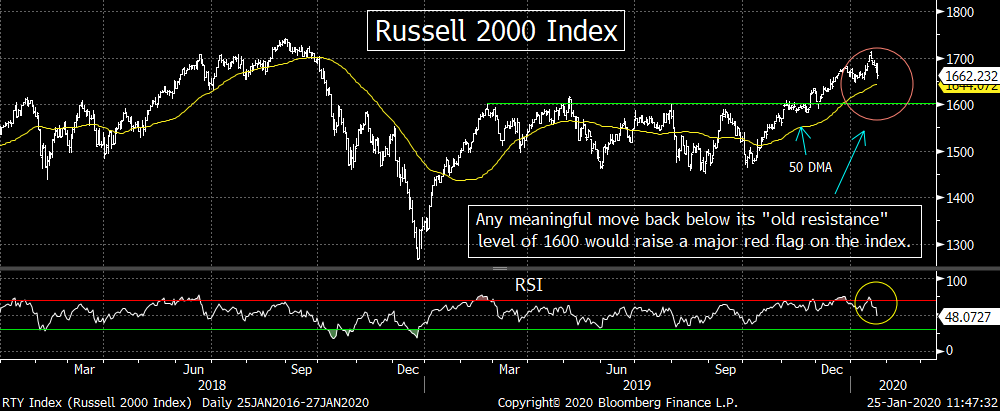
2a) The Russell 2000 is closer to ITS key support levels.
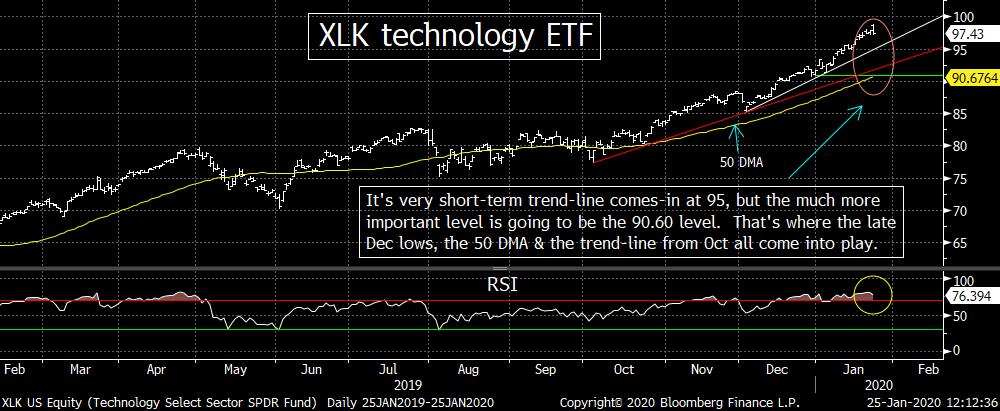
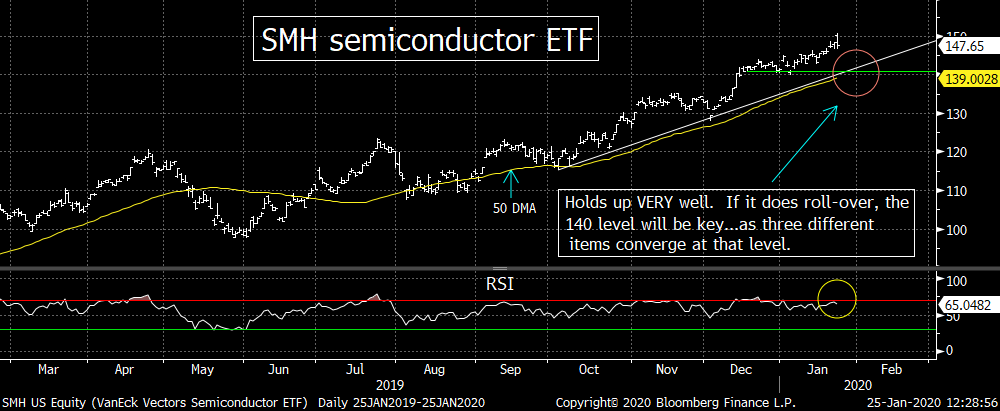
3) Key levels for the important tech ETFs (XLK & SMH).
4) The yield on the U.S. 10yr note is also testing an important level.
5) Utilities have gone parabolic.
5a) The bank ETFs (KBE & KRE) are quite close to their next support levels.
6) The rally in the XLU shows how the algos distort things today, so stay nimble.
7) Sentiment reached pretty extreme levels early last week.
8) Gold’s recent action was good…even before Friday.
9) Tucker Carlson is terrified of Michael Bloomberg.
10) I HATE Ely Manning…BUT I do think be belongs in the HOF.
11) Summery of our current stance.
Short Version:
1) It’s impossible to know how this coronavirus will playout or what kind of impact it will have on the markets. However, since the market was overbought, overvalued (or at least highly valued) and over-loved early last week, it was (and still is) vulnerable…..We’d also note that Friday gave us “outside-down” days in several key averages. Those days are signs of exhaustion and are frequently followed by pull-backs that last for more than a day or two.
2) If (repeat, IF) the stock market does fall further, we’ll be watching certain key levels on the S&P and the Nasdaq. If they break those levels, it will signal that something more meaningful than just a hiccup is going to take place. A move below the 50 DMA (which would also give them their first “lower-lows” in many months) are the first levels we’re watching. (First two charts below.)
2a) The Russell 2000 Index has the same support level, but its support level is much closer to where it stands after Friday’s close. Thus it’s one we’ll be watching quite closely…right from the get-go next week. (3rd & 4th charts below.)
3) Looking at the key tech ETFs (the XLK & SMH), the XLK is quite similar. A break below its 50 DMA would send up a warning flag, but we have to admit that this level is still 7% away from current levels….The SMH is a bit closer (5% away)…and that is also where its trend-line from early October comes-in. In other words, the tech ETFs have a bit more wiggle room, but these are the lines we’ll be watching if they do indeed see more weakness. (5th & 6th charts below.)
Matthew J. Maley
Managing Director
Chief Market Strategist
Miller Tabak + Co., LLC
Founder, The Maley Report
TheMaleyReport.com
275 Grove St. Suite 2-400
Newton, MA 02466
617-663-5381
Although the information contained in this report (not including disclosures contained herein) has been obtained from sources we believe to be reliable, the accuracy and completeness of such information and the opinions expressed herein cannot be guaranteed. This report is for informational purposes only and under no circumstances is it to be construed as an offer to sell, or a solicitation to buy, any security. Any recommendation contained in this report may not be appropriate for all investors. Trading options is not suitable for all investors and may involve risk of loss. Additional information is available upon request or by contacting us at Miller Tabak + Co., LLC, 200 Park Ave. Suite 1700, New York, NY 10166.
Recent free content from Matt Maley
-
 THE WEEKLY TOP 10
— 10/23/22
THE WEEKLY TOP 10
— 10/23/22
-
Morning Comment: Can the Treasury market actually give the stock market some relief soon?
— 10/21/22
-
What Do 2022 and 1987 Have in Common?
— 10/19/22
-
Morning Comment: Which is it? Is stimulus bullish or bearish for the stock market?
— 10/17/22
-
Morning Comment: Peak Inflation is Becoming a Process Instead of a Turning Point
— 10/13/22
-
{[comment.author.username]} {[comment.author.username]} — Marketfy Staff — Maven — Member

- 1 Campus Martius, Suite #200Detroit, MI 48226
- +1 877 440 9464