

The Action is Getting Sloppy...
Good morning and welcome back. The Fed is clearly the focus right now. But since it's Monday, let's get right to our weekly review of the state of the market and our major market indicators/models.
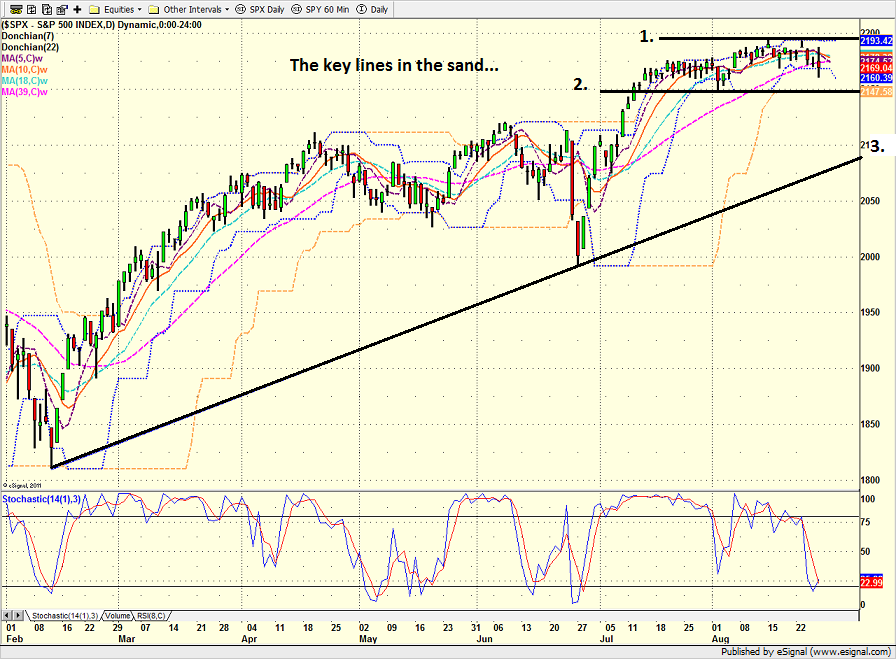
As usual, the first stop is a review of the price/trend of the market. Here's my current take on the state of the technical picture...
- Market traded "sloppy" from Tuesday's open forward
- Short-term downtrend appears to be developing
- A close below 2157 would indicate a downtrend was picking up steam
- A close below 2145 would put bears in charge
- The dollar seems to be the driver of the current decline in stocks (dollar strength hurts multinational earnings)
- Adjustment of rate expectations (Fischer saying 2 moves in 2016) likely key focus in short-term
- Bears may also start yammering on about potential head-and-shoulders top formation
S&P 500 - Daily 
View Larger Image
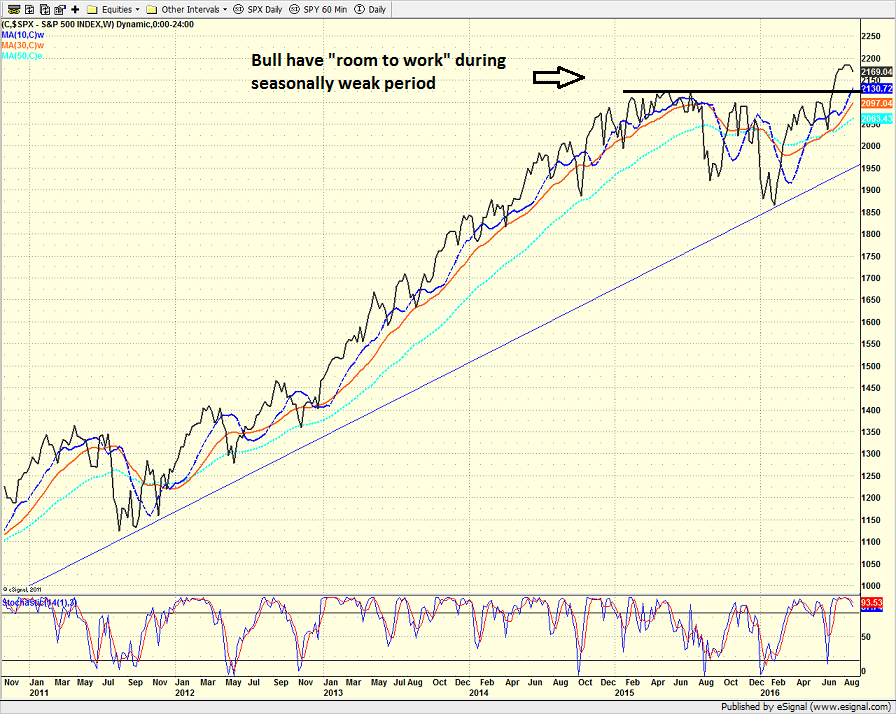
From a longer-term perspective (e.g. looking at a weekly chart of the S&P 500)...
- Bulls appear to be taking a break - could be the "pause that refreshes" - or start of meaningful downtrend. We shall see...
- Downside action above 2130 likely just "noise" at this time
- Weekly close below 2130 would be a setback for bulls
- Weekly close below 2035 would represent a "lower low" and be a real problem for bull camp
- From big-picture standpoint, the key line in the sand on weekly chart is the long-term uptrend line - currently sitting at 1950
S&P 500 - Weekly 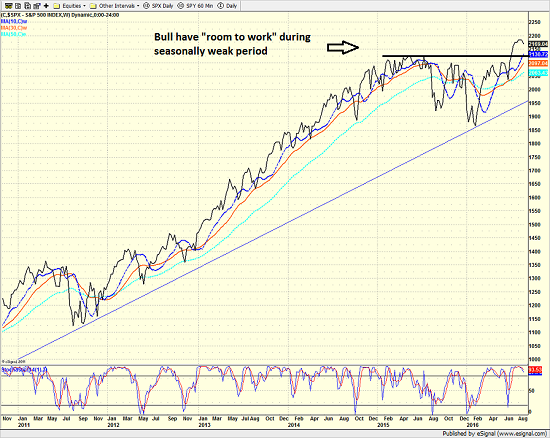
View Larger Image
Next, let's look at the "state of the trend" from our indicator panel. These indicators are designed to give us a feel for the overall health of the current short- and intermediate-term trend models.
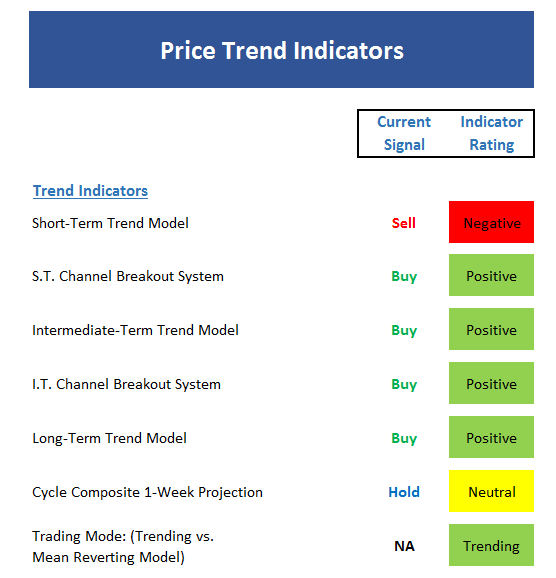
- Short-term trend model broke down
- Short-term channel system remains positive - but a break below 2160 would trigger a sell
- Intermediate-term trend model still fine
- Intermediate-term channel system still on a buy - sell at 2147
- Long-term trend model still solidly positive
- Cycle composite is neutral for upcoming week but then points lower until early October
- Market still in "trending" mode for now
Now we turn to the momentum indicators...
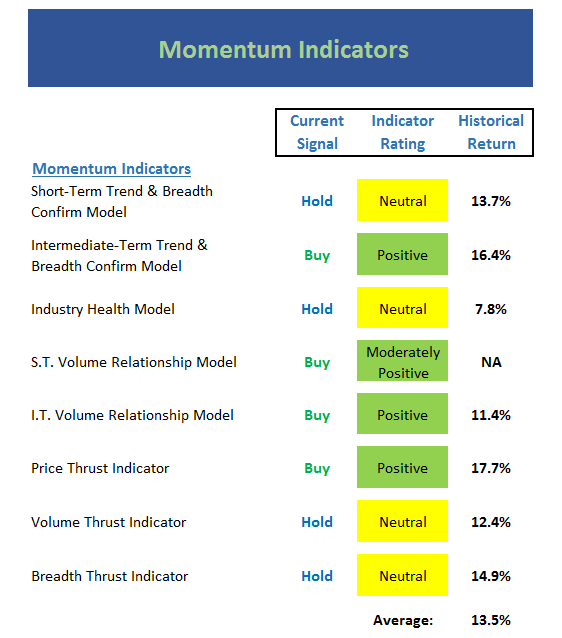
- Short-term Trend & Breadth Confirm model downticked to neutral but historical return in this mode still above average at 13.7% annualized
- Industry Health model downticked to neutral. Disappointing. Tells me that momentum has weakened.
- Short-term Volume Relationship also weakening, but overall rating remains moderately positive
- No change to the Thrust indicators this week - still neutral
Next up is the "early warning" board, which is designed to indicate when traders may start to "go the other way" for a trade.

- S&P now modestly oversold from short-term perspective
- However, market back to overbought from intermediate-term point of view
- The VIX Indicator is actually close to giving a preliminary buy signal (but hasn't yet)
- Short- and Intermediate-term sentiment models have improved to neutral (meaning sentiment isn't as rosy as it was)
- Overall board is now more neutral - doesn't favor either team
Now let's move on to the market's "external factors" - the indicators designed to tell us the state of the big-picture market drivers including monetary conditions, the economy, inflation, and valuations.
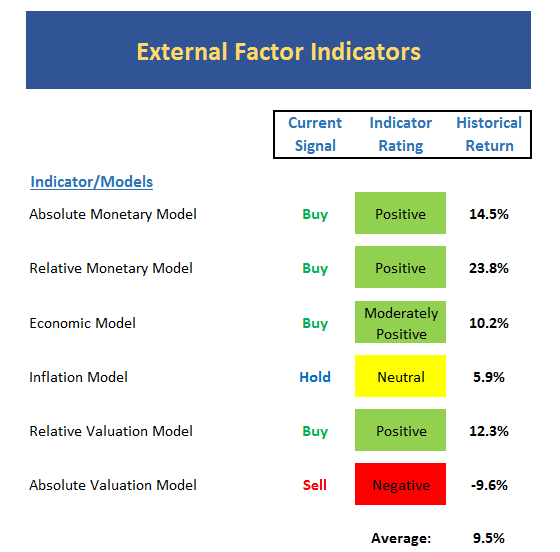
- The Economic model upticked last week
- An Inflation component model upticked to the "moderate inflation" mode last week
- Monetary conditions should pull back a bit based on increasing expectations of rate hikes
- Overall historical model returns still in line with long-term average
Finally, let's review our favorite big-picture market models, which are designed to tell us which team is in control of the prevailing major trend.
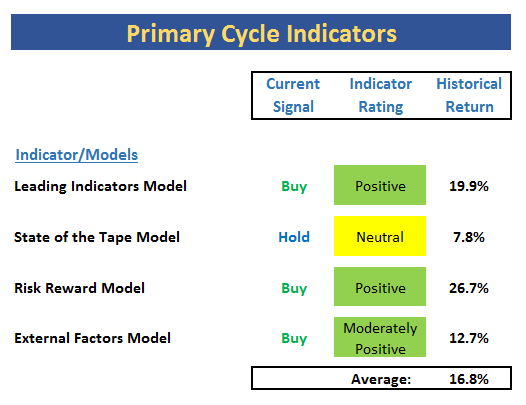
- The State of the Tape model downticked into the neutral zone last week
- Leading Indicators model actually upticked to 90% last week
- Risk/Reward model remains positive
- External Factors model still moderately positive
- Overall the board remains positive
The Takeaway...
From a short-term perspective, stocks have entered a downtrend. However, the intermediate-term uptrend remains intact. Thus, we will call the near-term action "sloppy." The main issue here is dollar strength and worries about what the Fed will/won't do is causing uncertainty (remember strong dollar hurts multinational earnings). Also keep in mind that we're entering a seasonally weak period that has historically produced some downside fireworks. However, with stocks no longer overbought and sentiment no longer extreme, we would expect any downside action to present an opportunity to add to long positions.
Current Market Drivers
We strive to identify the driving forces behind the market action on a daily basis. The thinking is that if we can both identify and understand why stocks are doing what they are doing on a short-term basis; we are not likely to be surprised/blind-sided by a big move. Listed below are what we believe to be the driving forces of the current market (Listed in order of importance).
1. The State of Global Central Bank Policies
2. The State of U.S. Economic Growth
3. The State of the U.S. Dollar
Thought For The Day:
Smooth seas do not make skillful sailors. -African Proverb
Wishing you green screens and all the best for a great day,

David D. Moenning
Chief Investment Officer
Sowell Management Services
Looking for a "Modern" approach to Asset Allocation and Portfolio Design?
Looking for More on the State of the Markets?
Investment Pros: Looking to modernize your asset allocations, add risk management to client portfolios, or outsource portfolio design? Contact Eric@SowellManagement.com
Disclosures
The opinions and forecasts expressed herein are those of Mr. David Moenning and may not actually come to pass. Mr. Moenning's opinions and viewpoints regarding the future of the markets should not be construed as recommendations. The analysis and information in this report is for informational purposes only. No part of the material presented in this report is intended as an investment recommendation or investment advice. Neither the information nor any opinion expressed constitutes a solicitation to purchase or sell securities or any investment program.
Any investment decisions must in all cases be made by the reader or by his or her investment adviser. Do NOT ever purchase any security without doing sufficient research. There is no guarantee that the investment objectives outlined will actually come to pass. All opinions expressed herein are subject to change without notice. Neither the editor, employees, nor any of their affiliates shall have any liability for any loss sustained by anyone who has relied on the information provided.
The analysis provided is based on both technical and fundamental research and is provided "as is" without warranty of any kind, either expressed or implied. Although the information contained is derived from sources which are believed to be reliable, they cannot be guaranteed.
David D. Moenning is an investment adviser representative of Sowell Management Services, a registered investment advisor. For a complete description of investment risks, fees and services, review the firm brochure (ADV Part 2) which is available by contacting Sowell. Sowell is not registered as a broker-dealer.
Employees and affiliates of Sowell may at times have positions in the securities referred to and may make purchases or sales of these securities while publications are in circulation. Positions may change at any time.
Investments in equities carry an inherent element of risk including the potential for significant loss of principal. Past performance is not an indication of future results.
Advisory services are offered through Sowell Management Services.
Recent free content from FrontRange Trading Co.
-
 Is The Bull Argument Too Easy These Days?
— 8/31/20
Is The Bull Argument Too Easy These Days?
— 8/31/20
-
What Do The Cycles Say About 2020?
— 1/21/20
-
Modeling 2020 Expectations (Just For Fun)
— 1/13/20
-
Tips From Real-World Wendy Rhoades
— 5/06/19
-
The Best Recession Ever!
— 4/29/19
-
{[comment.author.username]} {[comment.author.username]} — Marketfy Staff — Maven — Member


- 1 Campus Martius, Suite #200Detroit, MI 48226
- +1 877 440 9464