

Since It's Still September...
Good Monday morning and welcome back. Before we let the blinking screens take over our lives again, let's step back and start the week with a review of the state of the market and our objective major market indicators/models.
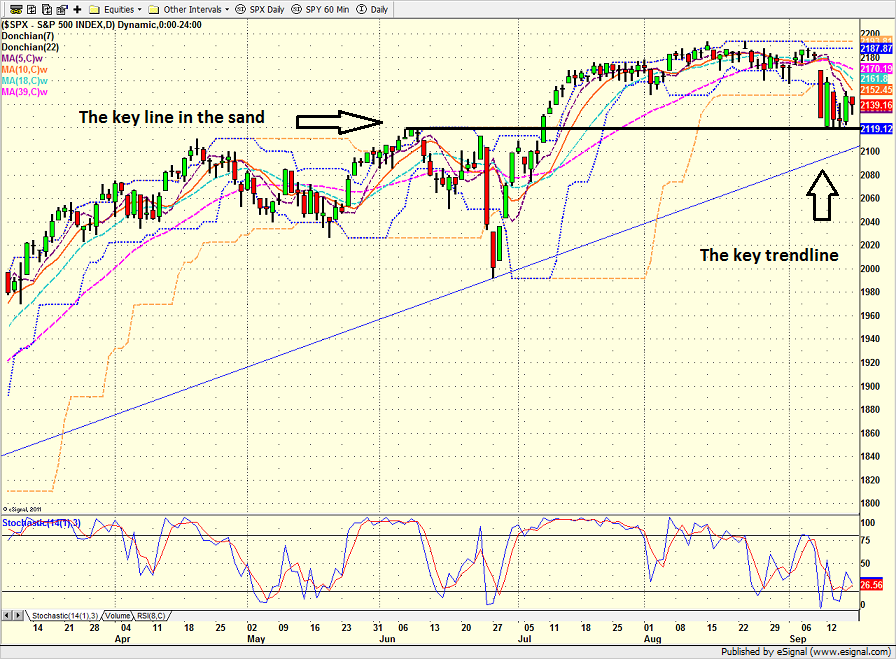
The first step is a review of the price/trend of the market. Here's my current take on the state of the technical picture...
- Since the calendar still reads September, market volatility is still with us
- The short-term trend remains negative
- But so far at least, the bulls have been able to hold the key support zone at 2120
- The key trendline currently sits at around 2100
- If the bears manage to break through 2120, I'd expect a quick test of 2100
- If both important near-term technical levels are broken, stocks would be in full-blown price discovery mode
S&P 500 - Daily 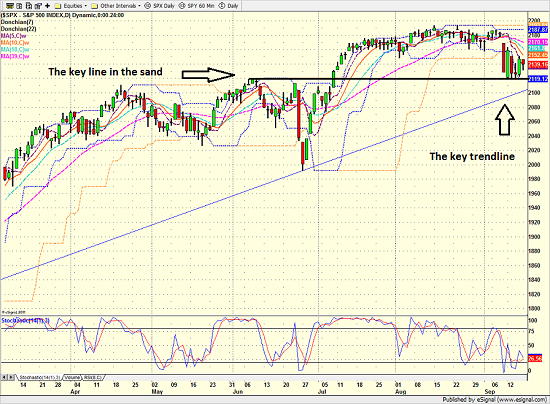
View Larger Image
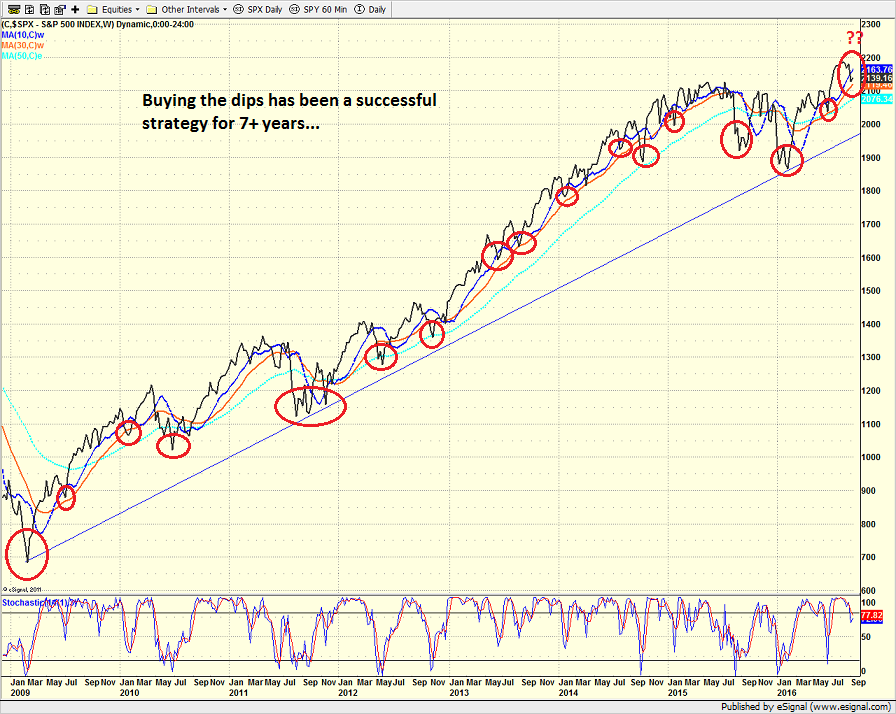
From a longer-term perspective (e.g. looking at a weekly chart of the S&P 500)...
- Important support is also being tested on the weekly chart
- The key levels on the weekly chart are the same as those seen on the intraday daily chart: 2120 and 2100
- However, the weekly trend would remain technically healthy unless the S&P were to close below 2025, making a "lower low" in the process
- As you can see from the chart below, buying the dips has been a very successful strategy for the past 7 and a half years. Sure, there have been times when buying after the first weekly low would have been uncomfortable for a while, but the pain would have been short-lived.
- If I was a dip-buyer, I would give myself at least a couple shots at it. And I'd be very tempted to take the first one here.
S&P 500 - Weekly 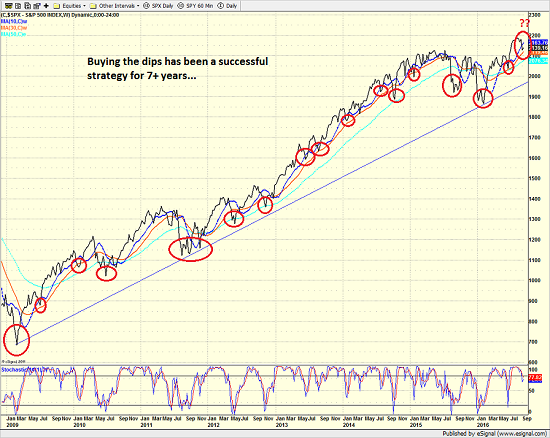
View Larger Image
Next, let's look at the "state of the trend" from our indicator panel. These indicators are designed to give us a feel for the overall health of the current short- and intermediate-term trend models.
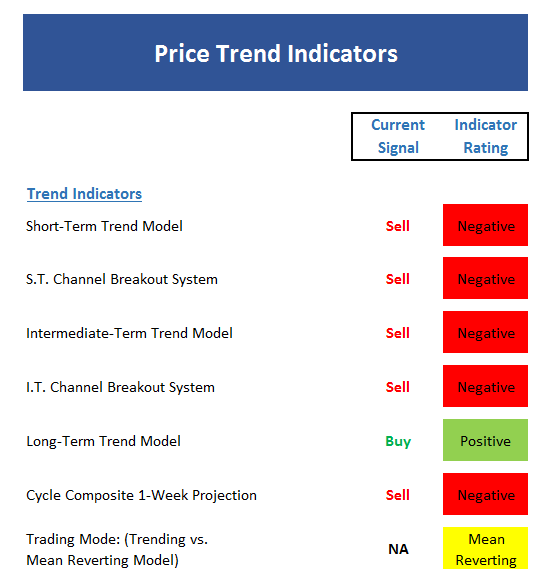
- With stocks spending last week making and testing the lows of this move, it isn't surprising to see so much red on the board here
- The traditional channel breakout method remains negative for both the short- and intermediate-term systems
- In mean-reverting environments, I prefer to use a more sensitive approach, which at this time is on a buy signal with a stop at 2119
- Two of the three models that determine whether the market is in a trending or mean-reverting mode have flipped to mean-reverting - and the third one is very close
- The cycle composite (a combination of the 1-year seasonal, the 4-year Presidential, and the 10-year decennial cycles) is pointing down again this week
Now we turn to the momentum indicators...
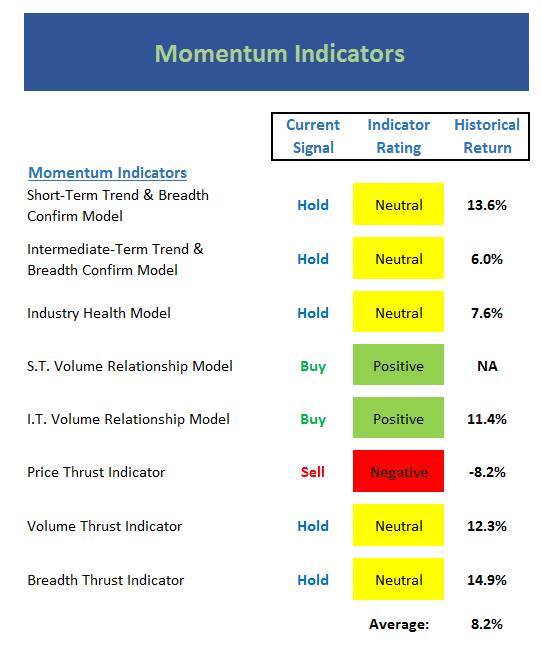
- With stocks in decline for the last six sessions, it is a little surprising that the momentum board isn't more negative
- The two big bounce days have managed to keep the short-term trend and breadth confirm neutral
- The short-term volume relationship model remains positive - albeit just barely
- The volume thrust model flip-flopped last week between negative and neutral
- The industry health model is falling but still in the neutral zone
- In sum, it wouldn't take much to turn this board into a sea of red - but as long as the bulls can hang on in the near term...
Next up is the "early warning" board, which is designed to indicate when traders may start to "go the other way" -- for a trade.
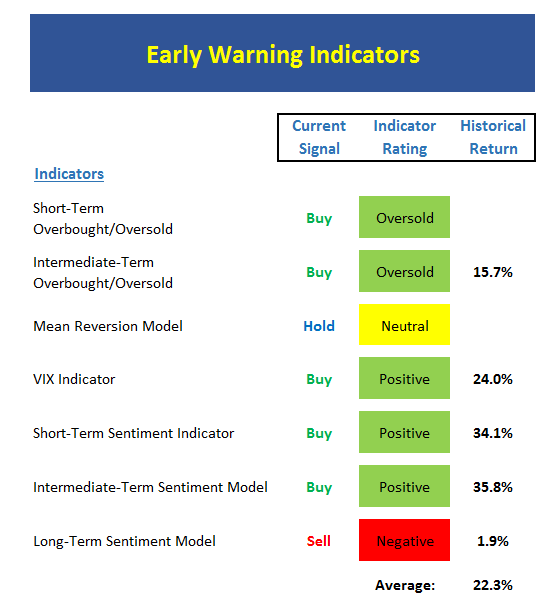
- With a near-term low and several days of testing, the early warning indicators are raising their hands, looking for some attention
- Both the short- and intermediate-term models suggest stocks are oversold
- The mean reversion model is very close to flashing a buy signal
- The VIX models have already given their buy signals
- Sentiment has become negative (a good thing) fairly quickly from the short- and intermediate-term perspectives
- The historical returns of the early warning models are very strong at this time
- This board suggests that dip-buyers should be taking action in here
Now let's move on to the market's "external factors" - the indicators designed to tell us the state of the big-picture market drivers including monetary conditions, the economy, inflation, and valuations.
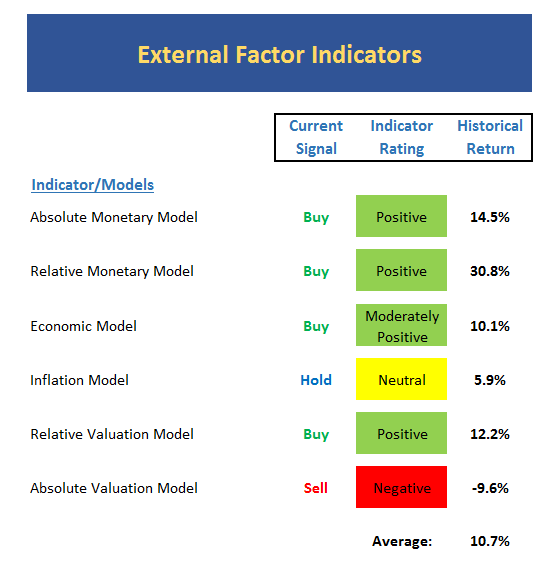
- Although rates have spiked a bit lately, the monetary models are still sitting at the highs for the year
- And while the recent data has been rather punk, the economic model remains in decent shape
- As I've been saying for weeks now, the trend of the inflation model and a component model of inflation expectations has been up
- The valuation story remains the same as relative valuations (i.e. valuations compared to rates) are low while absolute valuations (traditional P/E, P/D, P/B etc.) remain very high.
- From my seat, the two valuation models cancel each other out at this time - so I'm neutral on the subject
- The average historical return of the board remains at the long-term average.
Finally, let's review our favorite big-picture market models, which are designed to tell us which team is in control of the prevailing major trend.
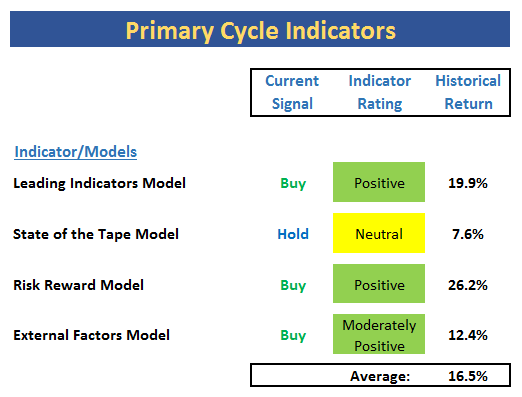
- The leading indicator model has been steadfastly positive during the past couple weeks (primarily due to the fact that most of these indicators are long-term in nature)
- The state of the tape model continues to disappoint. This tells me the internal technical health of the market isn't great
- The risk/reward model (a model-of-models that contains hundreds of indicators) is still in good shape
- The external factors model is still green, but not by much. To me, this is the most worrisome sign on the entire page because the model was declining before the selloff began.
- The average historical return of the board remains well above the historical norm
The Takeaway...
Stocks remain in a near-term downtrend and the major indices are testing important support zones. The market is oversold from both a short- and intermediate-term point of view. However, the momentum indicators, while still in a fragile state, are not as negative as one might expect here. And the longer-term, bigger-picture models suggest that the bull market remains alive and well. Thus, I will conclude that the dip-buying is likely about to commence in the coming couple of weeks. However, with both the U.S. Federal Reserve and the Bank of Japan holding meetings this week, traders may prefer a wait-and-see approach - at least until Wednesday afternoon when Janet Yellen steps to the microphone.
Current Market Drivers
We strive to identify the driving forces behind the market action on a daily basis. The thinking is that if we can both identify and understand why stocks are doing what they are doing on a short-term basis; we are not likely to be surprised/blind-sided by a big move. Listed below are what we believe to be the driving forces of the current market (Listed in order of importance).
1. The State of Global Central Bank Policies
2. The State of U.S. Economic Growth
3. The State of the Global Bond Market
4. The State of the U.S. Dollar
Thought For The Day:
"We must not look to government to solve our problems. Government is the problem" -- Ronald Reagan
Wishing you green screens and all the best for a great day,

David D. Moenning
Chief Investment Officer
Sowell Management Services
Looking for a "Modern" approach to Asset Allocation and Portfolio Design?
Looking for More on the State of the Markets?
Investment Pros: Looking to modernize your asset allocations, add risk management to client portfolios, or outsource portfolio design? Contact Eric@SowellManagement.com
Disclosures
The opinions and forecasts expressed herein are those of Mr. David Moenning and may not actually come to pass. Mr. Moenning's opinions and viewpoints regarding the future of the markets should not be construed as recommendations. The analysis and information in this report is for informational purposes only. No part of the material presented in this report is intended as an investment recommendation or investment advice. Neither the information nor any opinion expressed constitutes a solicitation to purchase or sell securities or any investment program.
Any investment decisions must in all cases be made by the reader or by his or her investment adviser. Do NOT ever purchase any security without doing sufficient research. There is no guarantee that the investment objectives outlined will actually come to pass. All opinions expressed herein are subject to change without notice. Neither the editor, employees, nor any of their affiliates shall have any liability for any loss sustained by anyone who has relied on the information provided.
The analysis provided is based on both technical and fundamental research and is provided "as is" without warranty of any kind, either expressed or implied. Although the information contained is derived from sources which are believed to be reliable, they cannot be guaranteed.
David D. Moenning is an investment adviser representative of Sowell Management Services, a registered investment advisor. For a complete description of investment risks, fees and services, review the firm brochure (ADV Part 2) which is available by contacting Sowell. Sowell is not registered as a broker-dealer.
Employees and affiliates of Sowell may at times have positions in the securities referred to and may make purchases or sales of these securities while publications are in circulation. Positions may change at any time.
Investments in equities carry an inherent element of risk including the potential for significant loss of principal. Past performance is not an indication of future results.
Advisory services are offered through Sowell Management Services.
Recent free content from FrontRange Trading Co.
-
 Is The Bull Argument Too Easy These Days?
— 8/31/20
Is The Bull Argument Too Easy These Days?
— 8/31/20
-
What Do The Cycles Say About 2020?
— 1/21/20
-
Modeling 2020 Expectations (Just For Fun)
— 1/13/20
-
Tips From Real-World Wendy Rhoades
— 5/06/19
-
The Best Recession Ever!
— 4/29/19
-
{[comment.author.username]} {[comment.author.username]} — Marketfy Staff — Maven — Member


- 1 Campus Martius, Suite #200Detroit, MI 48226
- +1 877 440 9464