

Should We Be Worried About the Economy?
Going through the myriad of indicators and models I review each week, I was surprised to find that my primary economic model (which is developed and maintained by Ned Davis Research) had slipped from neutral to moderately negative this week. In fact, the current weekly reading of the model had fallen to the lowest point since mid-2013. I reported the change in my weekly review that is published on Monday. This prompted a call from one of our financial advisors, who wanted to know if we shouldn't now be worried about a recession.
On the surface, such a question makes complete sense. When an economic model moves into a moderately negative zone, it is logical to project that the economy might be in trouble.
However, it is important to note that this model is designed to use economic indicators to "call" the stock market - not the state of the economy.
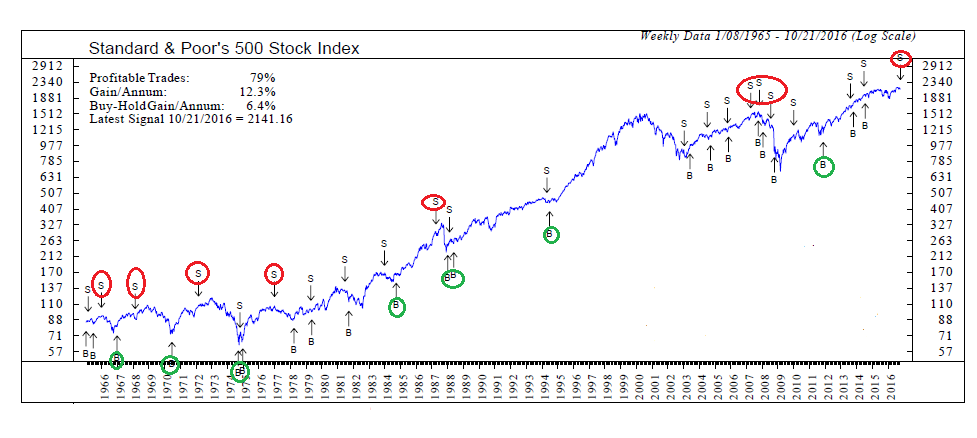
Historically, the model's hypothetical buy and sell signals (which I have been watching for more than a decade) would have been pretty good. Assuming you went long the S&P 500 when the model was on a buy signal and then moved to cash when the model was on sell signals, the results are pretty good. Going back to 1965 and applying the signals would have produced a hypothetical annualized gain of +12.3% per year, which is nearly double the buy-and-hold annualized return of +6.4%. And 79% of the hypothetical trades would have been profitable.
The disconcerting part about the model's most recent reading is that the S&P 500 has lost ground at an annualized rate of -8.5% per year when the model has been in the current moderately negative mode. While not good by any means, this also isn't as bad as the -23.0% annualized return seen when the model is rated as outright negative.
In looking at the historical signals of the model, I note that the sell signals tend to be either early or false. On the positive side, good signals (circled on the chart below in red) were given well in advance of the big stock market declines seen in 1966, 1968, 1973-74, 1977, 1987, and 2008.

There have been some pretty darn good buy signals as well - I've circled these in green.
However, it is notable that the there was no sell signal given before the Tech Bubble Bear that began in 2000. This is likely due to the fact that the economy was doing "just fine" until after the stock market took a huge dive. It was after consumers saw their 401K's turn into "201K's" that the economy started to struggle.
Next, while there have some very good signals over the years, there have also been a BUNCH of signals that while technically profitable, weren't really good calls. And then more recently, there have been several sell signals that were quickly reversed.
So, the first key point on this fine Tuesday morning is that this type of signal isn't a reason to pack up and head for the hills. No, first I'd prefer to see such a big-picture signal confirmed by other models. And while some of my favorite models aren't in great shape at the present time, they also aren't anywhere close to issuing "sell" signals.
In addition, I'd like to see some time go by so that a "quick reversal" doesn't occur on this model. In other words, if this model is still negative a couple months from now, it might then be a reason to worry - at least a little.
Now About the Economy...
Getting back to the question at hand, the models I review that are designed to "call" the state of the economy remain in good shape. In fact, the primary model I use currently stands in the "strong growth" mode. And while we can argue all day long about how the economy isn't exactly humming along here, the takeaway is that the economic model isn't even remotely close to being negative.
I recognize that this morning's market missive has been pretty "geeky." However, I was hoping that there might be some value in "esplainin" the methodology that goes into some the indicators - and perhaps, more importantly, how best to use some of the indicators I report on each week.
In sum, I view the drop in the economic model designed to "call the stock market" as a warning flag and perhaps another reason not to have one's foot to the floor in this market. But at the same time, it is important to recognize that this remains a bull market until proven otherwise.
Current Market Drivers
We strive to identify the driving forces behind the market action on a daily basis. The thinking is that if we can both identify and understand why stocks are doing what they are doing on a short-term basis; we are not likely to be surprised/blind-sided by a big move. Listed below are what we believe to be the driving forces of the current market (Listed in order of importance).
1. The State of the Earnings Season
2. The State of Global Economies
3. The State of Global Central Bank Policies
4. The State of U.S. Dollar
Thought For The Day:
He who truly knows has no reason to shout. - Leonardo da Vinci
Wishing you green screens and all the best for a great day,

David D. Moenning
Chief Investment Officer
Sowell Management Services
Looking for a "Modern" approach to Asset Allocation and Portfolio Design?
Looking for More on the State of the Markets?
Investment Pros: Looking to modernize your asset allocations, add risk management to client portfolios, or outsource portfolio design? Contact Eric@SowellManagement.com
Disclosures
The opinions and forecasts expressed herein are those of Mr. David Moenning and may not actually come to pass. Mr. Moenning's opinions and viewpoints regarding the future of the markets should not be construed as recommendations. The analysis and information in this report is for informational purposes only. No part of the material presented in this report is intended as an investment recommendation or investment advice. Neither the information nor any opinion expressed constitutes a solicitation to purchase or sell securities or any investment program.
Any investment decisions must in all cases be made by the reader or by his or her investment adviser. Do NOT ever purchase any security without doing sufficient research. There is no guarantee that the investment objectives outlined will actually come to pass. All opinions expressed herein are subject to change without notice. Neither the editor, employees, nor any of their affiliates shall have any liability for any loss sustained by anyone who has relied on the information provided.
The analysis provided is based on both technical and fundamental research and is provided "as is" without warranty of any kind, either expressed or implied. Although the information contained is derived from sources which are believed to be reliable, they cannot be guaranteed.
David D. Moenning is an investment adviser representative of Sowell Management Services, a registered investment advisor. For a complete description of investment risks, fees and services, review the firm brochure (ADV Part 2) which is available by contacting Sowell. Sowell is not registered as a broker-dealer.
Employees and affiliates of Sowell may at times have positions in the securities referred to and may make purchases or sales of these securities while publications are in circulation. Positions may change at any time.
Investments in equities carry an inherent element of risk including the potential for significant loss of principal. Past performance is not an indication of future results.
Advisory services are offered through Sowell Management Services.
Recent free content from FrontRange Trading Co.
-
 Is The Bull Argument Too Easy These Days?
— 8/31/20
Is The Bull Argument Too Easy These Days?
— 8/31/20
-
What Do The Cycles Say About 2020?
— 1/21/20
-
Modeling 2020 Expectations (Just For Fun)
— 1/13/20
-
Tips From Real-World Wendy Rhoades
— 5/06/19
-
The Best Recession Ever!
— 4/29/19
-
{[comment.author.username]} {[comment.author.username]} — Marketfy Staff — Maven — Member


- 1 Campus Martius, Suite #200Detroit, MI 48226
- +1 877 440 9464