

Technical Talk: The Trend is Easy To See When...
One of the major tenets of my belief system for the markets is that it is vital to stay in tune with what a market "is doing." I learned a very long time ago that Ms. Market doesn't give a hoot what I think should happen next in the markets. And since no one has been able to consistently "call" the market in advance for any sustainable period of time, I don't see the point in trying. Thus, I check my ego and my opinions at the door each morning and go about the business of identifying what is actually happening in Ms. Market's game.
One of the best ways to go about this task is to review both the short- and longer-term action in the markets. And as the saying goes, a picture is worth a thousand words - so, I make it a habit to review hundreds of charts each week. Below are my "short-take" thoughts on the current state of the chart action.
Short-Term View
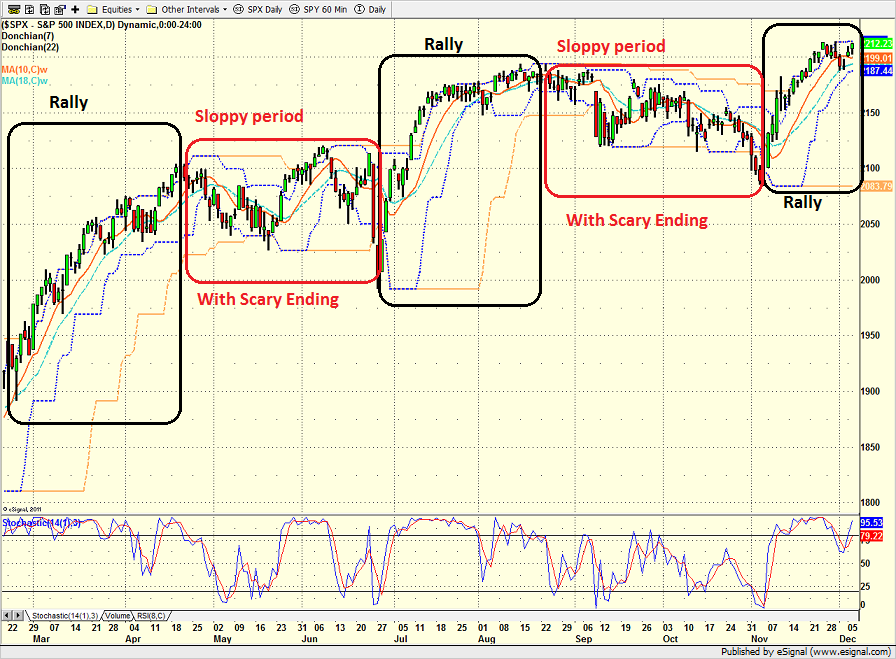
- The near-term trend is clearly up
- The current trend is much clearer on a chart of the Midcaps (see second chart)
- By the same token, the current trend on the NASDAQ is sideways due to the current rotation out of the so-called "FANG's"
- Since February 2016, stocks have followed the same pattern a couple times: A strong rally is followed by a period of sideways/sloppy consolidation - that has ended with some scary down days before the next rally ensues
- The question of the day is how far the current rally can go
- On the chart of the S&P 500, it looks like the rally has some room to run
- However, the charts of the small- and mid-cap indices suggest that stocks are overbought and due for a rest
- At the same time, it is important to remember the seasonal tailwinds favor the bulls
S&P 500 - Daily 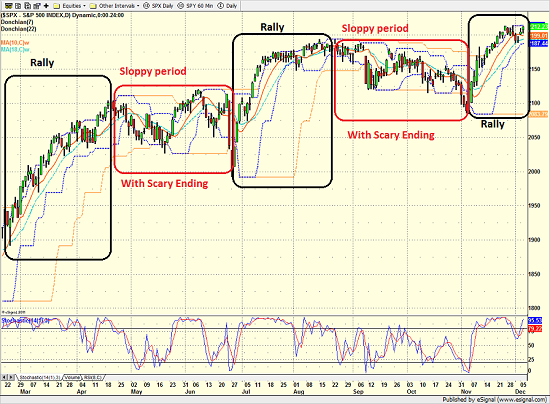
View Larger Image
SPDR Midcap 400 ETF (MDY) - Daily 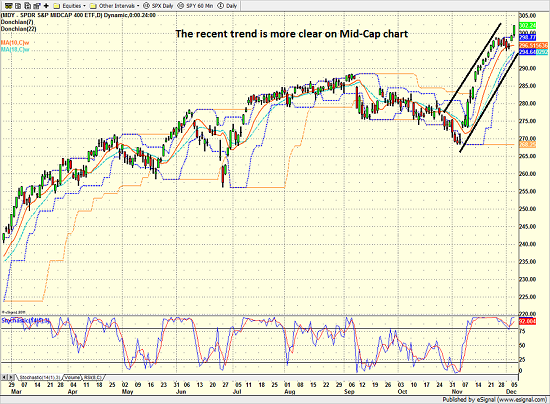
View Larger Image
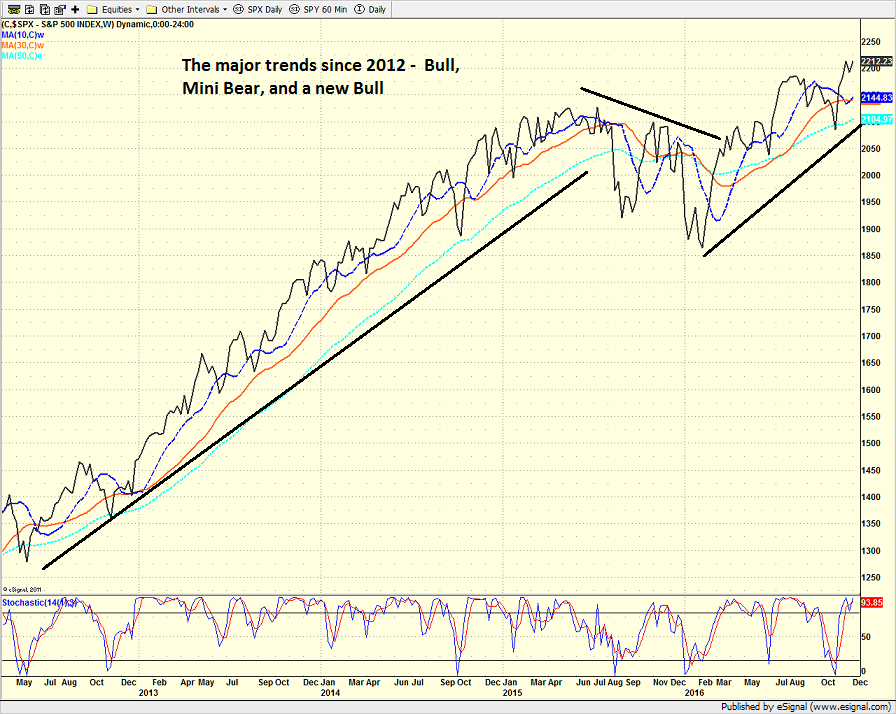
From a longer-term perspective (e.g. looking at a weekly chart of the S&P 500)...
Longer-Term View
- I've been saying for months that a new cyclical bull market began in mid-February of this year
- I've noted that the average cyclical bull that occurs within the context of a secular bull trend gains 106% (source: Ned Davis Research)
- This has led my team to maintain a fairly optimistic stance - especially since the summer
- The weekly chart of the S&P 500 makes the recent trends fairly clear
- First there was the bull that began in late 2011
- Then there was the "mini bear" that took place from summer 2015 through February 11, 2016
- And now there is the new cyclical bull
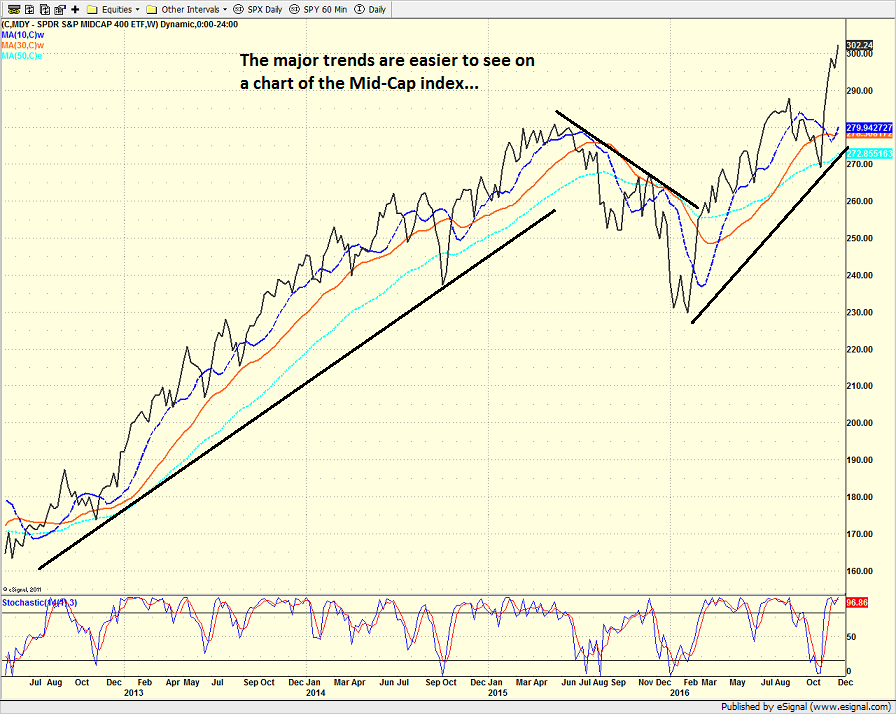
- The trends are much easier to see on the chart of the mid-cap index
S&P 500 - Weekly 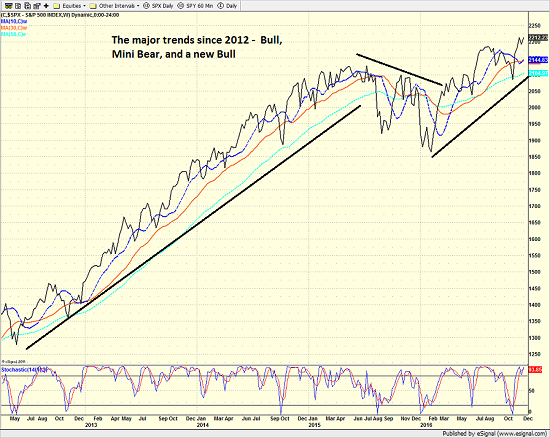
View Larger Image
SPDR Midcap 400 ETF (MDY) - Weekly 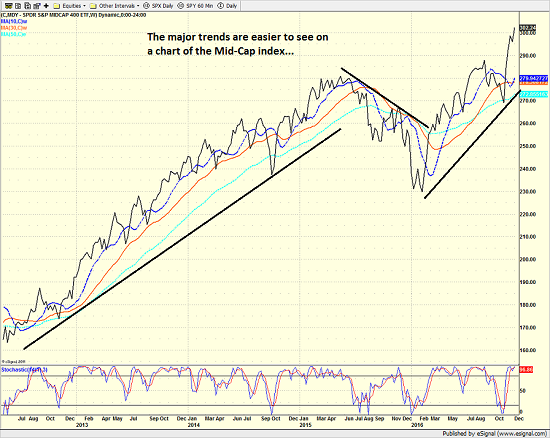
View Larger Image
Current Market Leadership
This week's leading sectors:
- Financials
- Industrials
- Energy
The Bottom Line
From my seat, the bottom line here is that (a) the trend is up, (b) stocks are overbought, (c) sentiment is a bit too rosy right now, and (d) the seasonal winds favor the bulls. Thus, I'm of the mind that traders should prepare for the inevitable short/sweet countertrend pullback, while investors should give the bulls the benefit of any doubt here and enjoy the ride.
Current Market Drivers
We strive to identify the driving forces behind the market action on a daily basis. The thinking is that if we can both identify and understand why stocks are doing what they are doing on a short-term basis; we are not likely to be surprised/blind-sided by a big move. Listed below are what we believe to be the driving forces of the current market (Listed in order of importance).
1. The State of the "Trump Trade"
2. The State of Global Central Bank Policies
3. The State of Global Economies
Thought For The Day:
Every day is a NEW beginning. So, take a deep breath and START AGAIN! -- Unkown
Wishing you green screens and all the best for a great day,

David D. Moenning
Chief Investment Officer
Sowell Management Services
Looking for a "Modern" approach to Asset Allocation and Portfolio Design?
Looking for More on the State of the Markets?
Investment Pros: Looking to modernize your asset allocations, add risk management to client portfolios, or outsource portfolio design? Contact Eric@SowellManagement.com
Disclosures
The opinions and forecasts expressed herein are those of Mr. David Moenning and may not actually come to pass. Mr. Moenning's opinions and viewpoints regarding the future of the markets should not be construed as recommendations. The analysis and information in this report is for informational purposes only. No part of the material presented in this report is intended as an investment recommendation or investment advice. Neither the information nor any opinion expressed constitutes a solicitation to purchase or sell securities or any investment program.
Any investment decisions must in all cases be made by the reader or by his or her investment adviser. Do NOT ever purchase any security without doing sufficient research. There is no guarantee that the investment objectives outlined will actually come to pass. All opinions expressed herein are subject to change without notice. Neither the editor, employees, nor any of their affiliates shall have any liability for any loss sustained by anyone who has relied on the information provided.
The analysis provided is based on both technical and fundamental research and is provided "as is" without warranty of any kind, either expressed or implied. Although the information contained is derived from sources which are believed to be reliable, they cannot be guaranteed.
David D. Moenning is an investment adviser representative of Sowell Management Services, a registered investment advisor. For a complete description of investment risks, fees and services, review the firm brochure (ADV Part 2) which is available by contacting Sowell. Sowell is not registered as a broker-dealer.
Employees and affiliates of Sowell may at times have positions in the securities referred to and may make purchases or sales of these securities while publications are in circulation. Positions may change at any time.
Investments in equities carry an inherent element of risk including the potential for significant loss of principal. Past performance is not an indication of future results.
Advisory services are offered through Sowell Management Services.
Recent free content from FrontRange Trading Co.
-
 Is The Bull Argument Too Easy These Days?
— 8/31/20
Is The Bull Argument Too Easy These Days?
— 8/31/20
-
What Do The Cycles Say About 2020?
— 1/21/20
-
Modeling 2020 Expectations (Just For Fun)
— 1/13/20
-
Tips From Real-World Wendy Rhoades
— 5/06/19
-
The Best Recession Ever!
— 4/29/19
-
{[comment.author.username]} {[comment.author.username]} — Marketfy Staff — Maven — Member


- 1 Campus Martius, Suite #200Detroit, MI 48226
- +1 877 440 9464