

Weekend Review and Watchlist
Overview
The S&P 500 and NASDAQ ended the week at all time highs on both a daily and weekly close basis. The Dow also closed at an all time high on a weekly basis, but finished just shy of the record daily close from 12/20. It did however reach an all time high on an intraday basis at 19,999.63.
A quick word about Dow 20,000. You can say it's irrelevant, and in terms of your process and how you invest it likely is. But have you ever made a big deal out of a milestone birthday either for yourself or someone else turning 30, 40, or 50? You know you have. Why? Isn't it irrelevant? Isn't age just a number?
Dow 20,000 might not mean much to the industry professional, but it should because it's significant to the man on the street, if only because it will ensure he becomes aware of it. No-one said a thing about Dow 18,274.69, or the S&P at 1,906.05. Industry professionals love to say that the S&P is more relevant than the Dow simply because of how they use the indices, but ask a random person on the street where the Dow, S&P, and NASDAQ currently are, and you can almost guarantee they'd have no clue on the S&P, and even less of a clue on the NASDAQ. But the Dow? They'd have a shot.
When the Dow hits a milestone it makes it into every newspaper and financial news show. To the casual investor it makes them check in on their portfolio to see how they're doing, and it may be the catalyst for them to start making some moves if they've been inactive for a while. Like any milestone or event worthy of a magazine cover, that level of attention does NOT necessarily mark the end of the trend, it simply means it's reached a point of mass recognition.
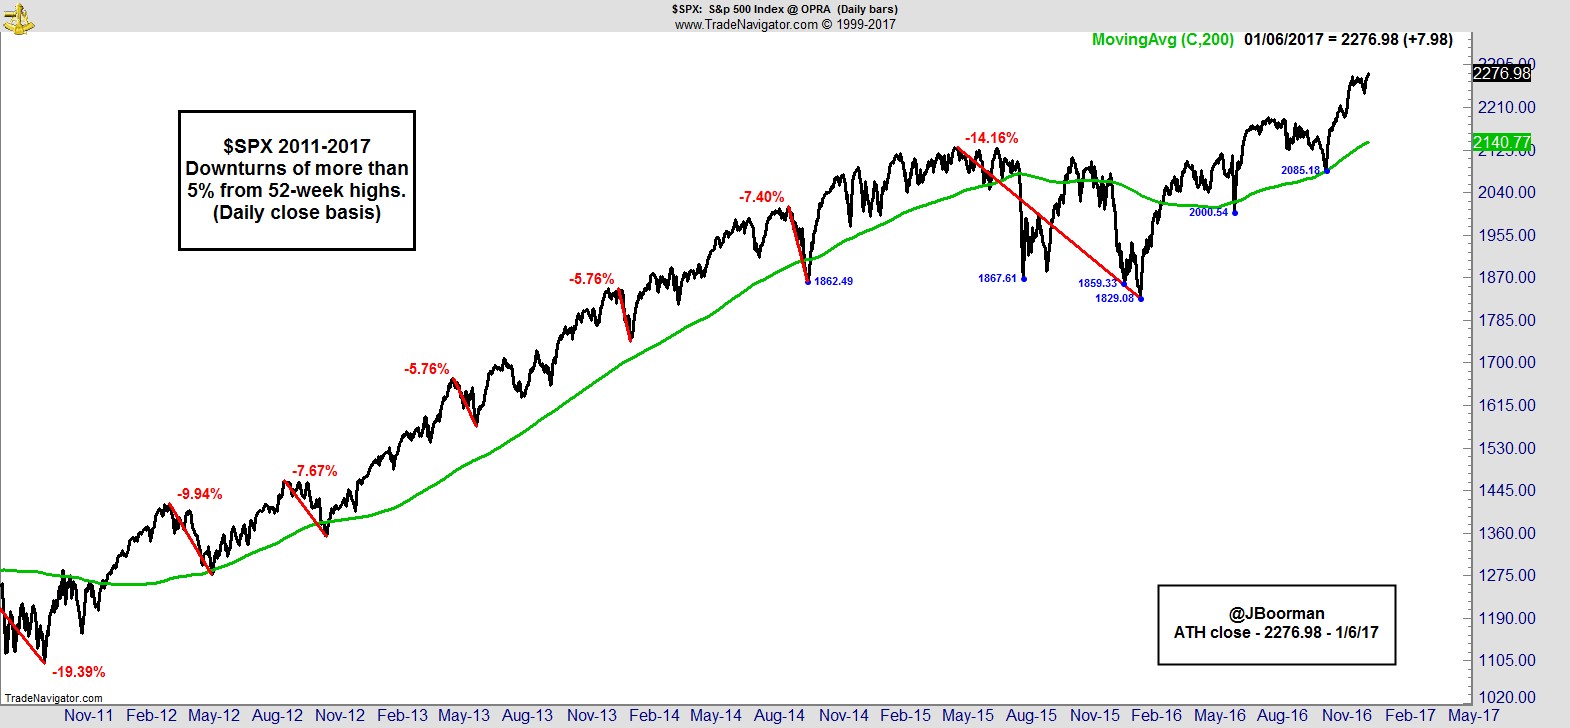
The S&P hasn't had a 5% pullback on a closing basis since the 2015/16 bear market ended. Currently it could pull back 5% and still be above its previous swing low, its 200-day MA, and the breakout level from July that marked the beginning of this new bull market.
.
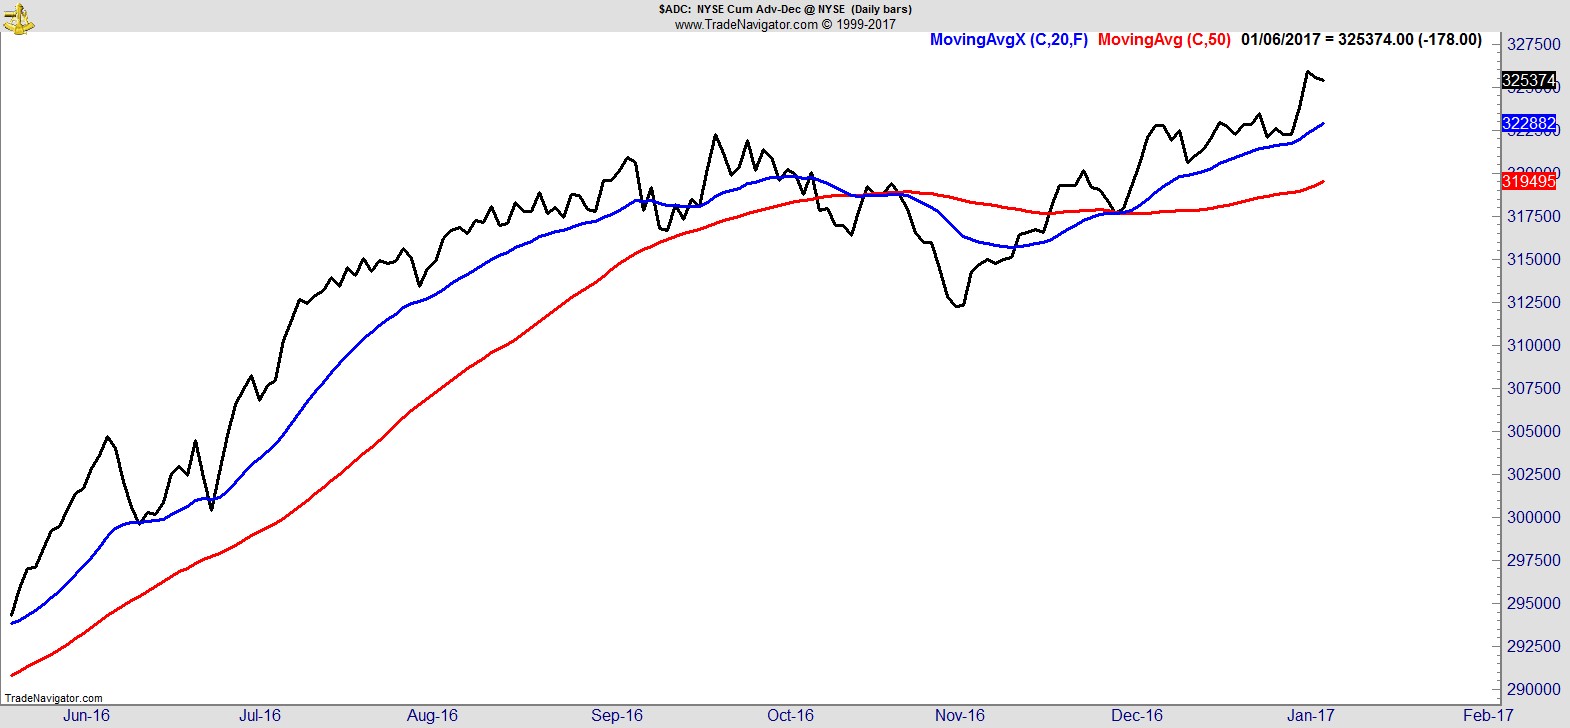
A quick word on breadth too. I sometimes see people highlighting a decrease in the number of 52-week highs as evidence that breadth is deteriorating, or the leadership is getting thinner. In my opinion this misrepresents what is actually occurring. Of course, an increase in the number of 52-wk highs is desirable and evidence of strength. It's always good to see. But a decrease is not evidence of poor breadth. Breadth in its purest form is the number of advancing issues relative to the number of declining issues, not the number that are making 52-wk highs.
Imagine for a moment, the entire stock market is made up of just 100 stocks. On a given day or week, 60 advance, 40 decline, breadth is good. Of those advancers, 20 make new 52-wk highs. The following week 75 advance and 25 decline, but there are just 5 new highs. Did breadth improve or deteriorate? It improved. So why were there fewer new highs? Because the issues that had previously been lagging subsequently bounced, and the issues that had been leading eased back. It's a crude and simple example but you get my point.
You just can't have it both ways. When two or three sectors make all the gains people say the leadership is too thin. Then when the other sectors start improving, without a major decrease in the former leaders, instead of welcoming the broader strength they highlight there are fewer new highs! There is nothing bearish about the current price action and breadth in the market, no matter how desperately people might be to find something.
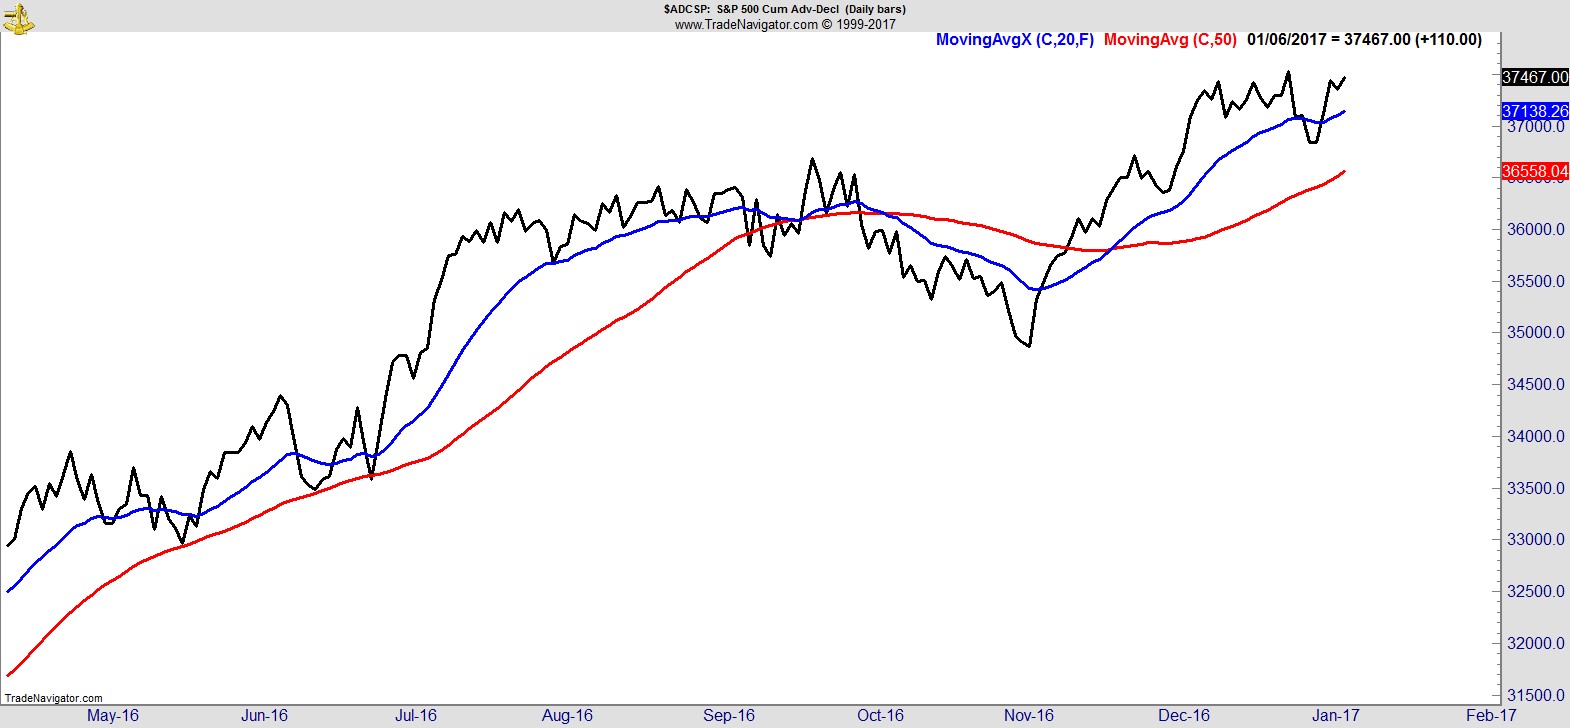
Here's breadth on the NYSE, and for the S&P 500. It looks good to me.
.
Sector Rankings
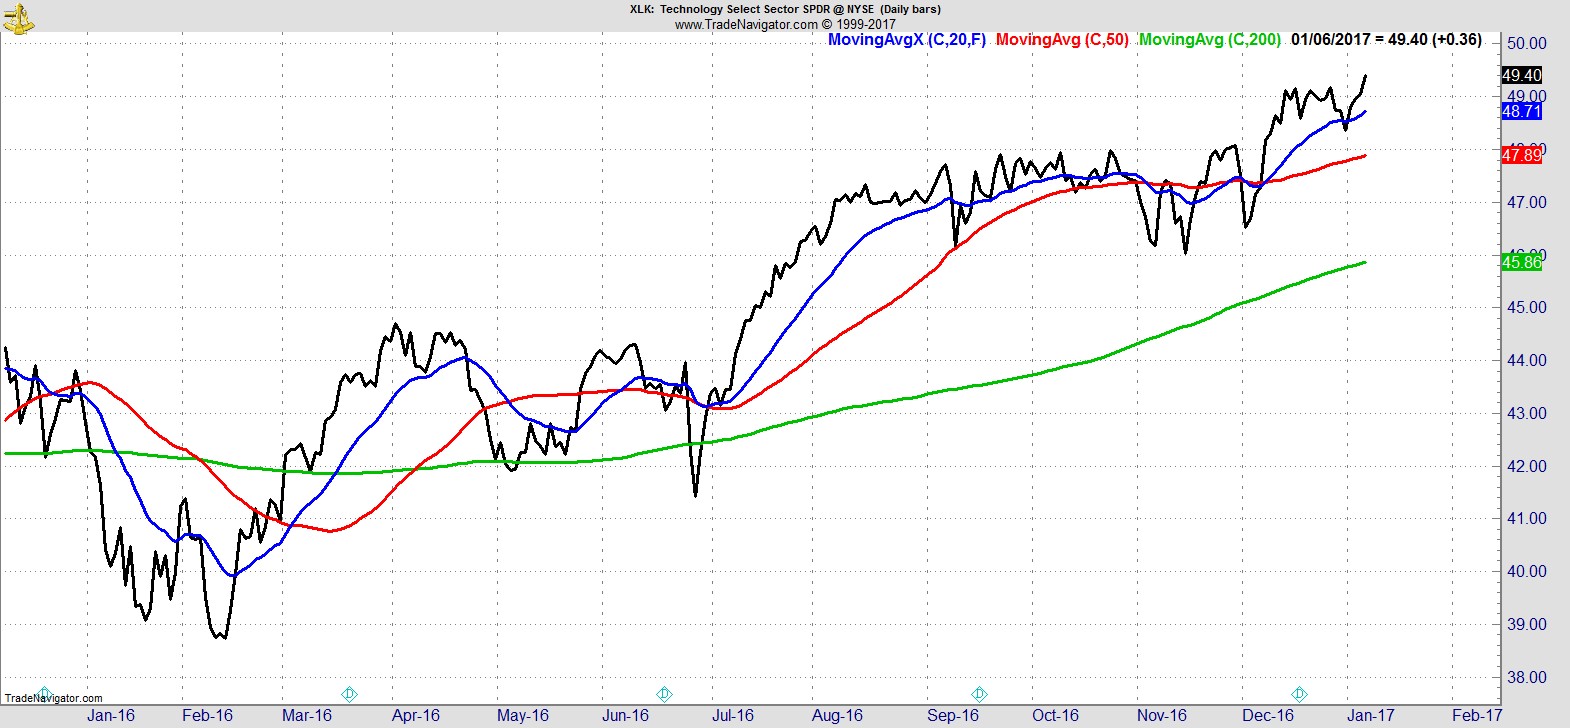
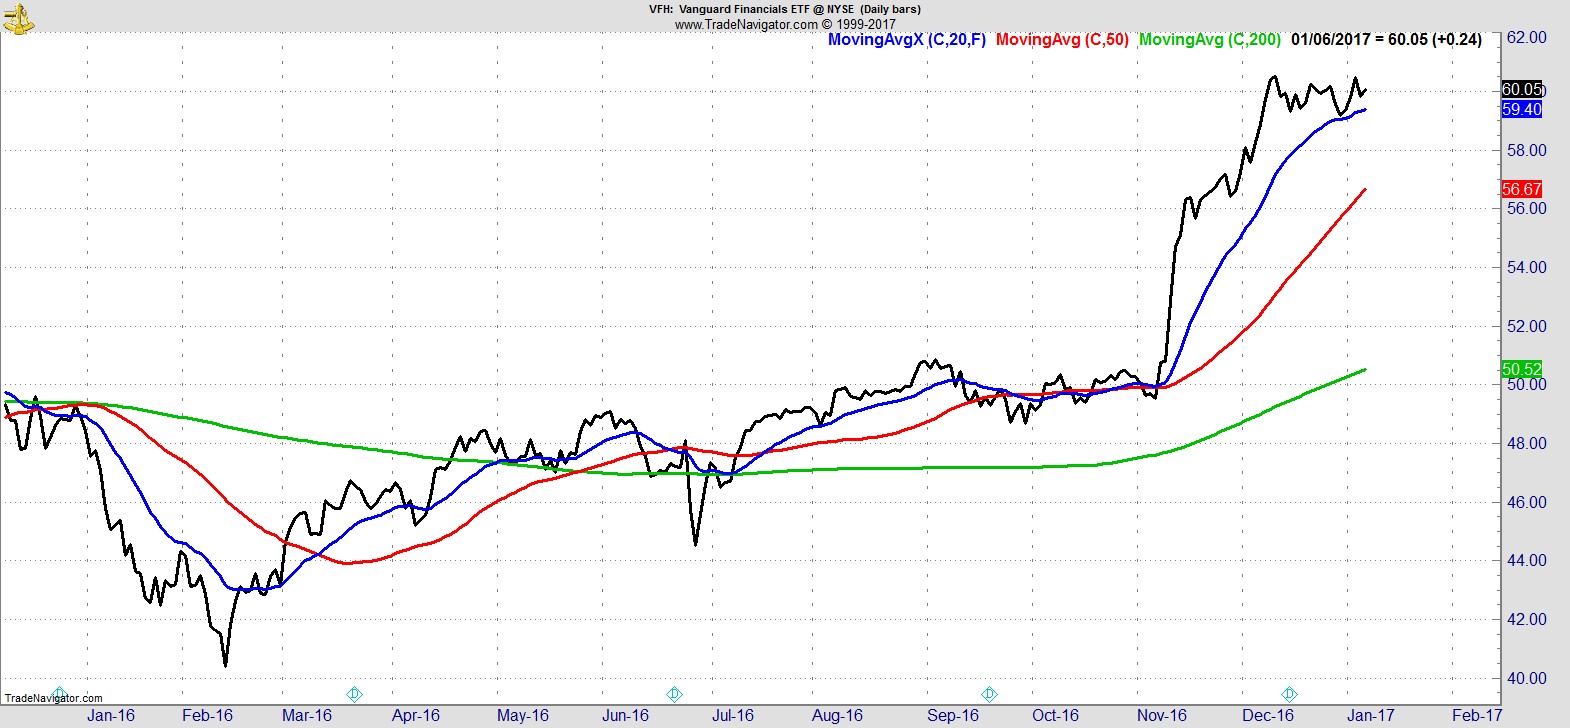
This week I have Tech at the top, ahead of Financials, They're followed by Industrials, Consumer Discretionary, Materials, and Energy. All six are above their 20, 50, and 200-day MAs, and at or near their recent highs.
.
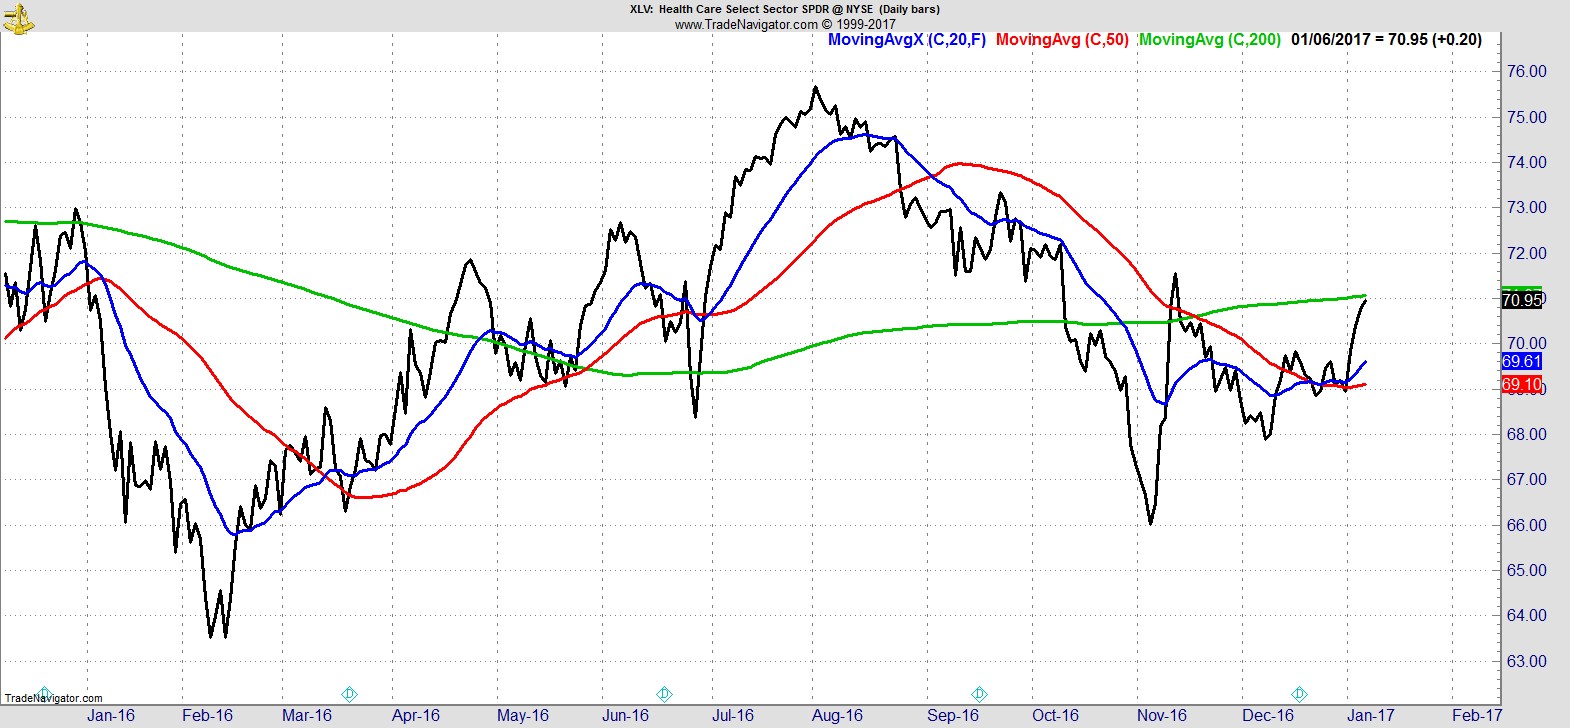
Next comes Healthcare which bounced strongly to test the underside of its 200-day MA. At the bottom I have Utilities, Real Estate, and Staples, which all improved but remain in downtrends on an intermediate basis.
.
Alpha Capture Portfolio
Our model portfolio finished +1.1% for the week vs +1.7% for the S&P. During the week we had one exit and have one more for Monday's open. That additional exit leaves the portfolio 82% long with 13 names.
.
Watchlist
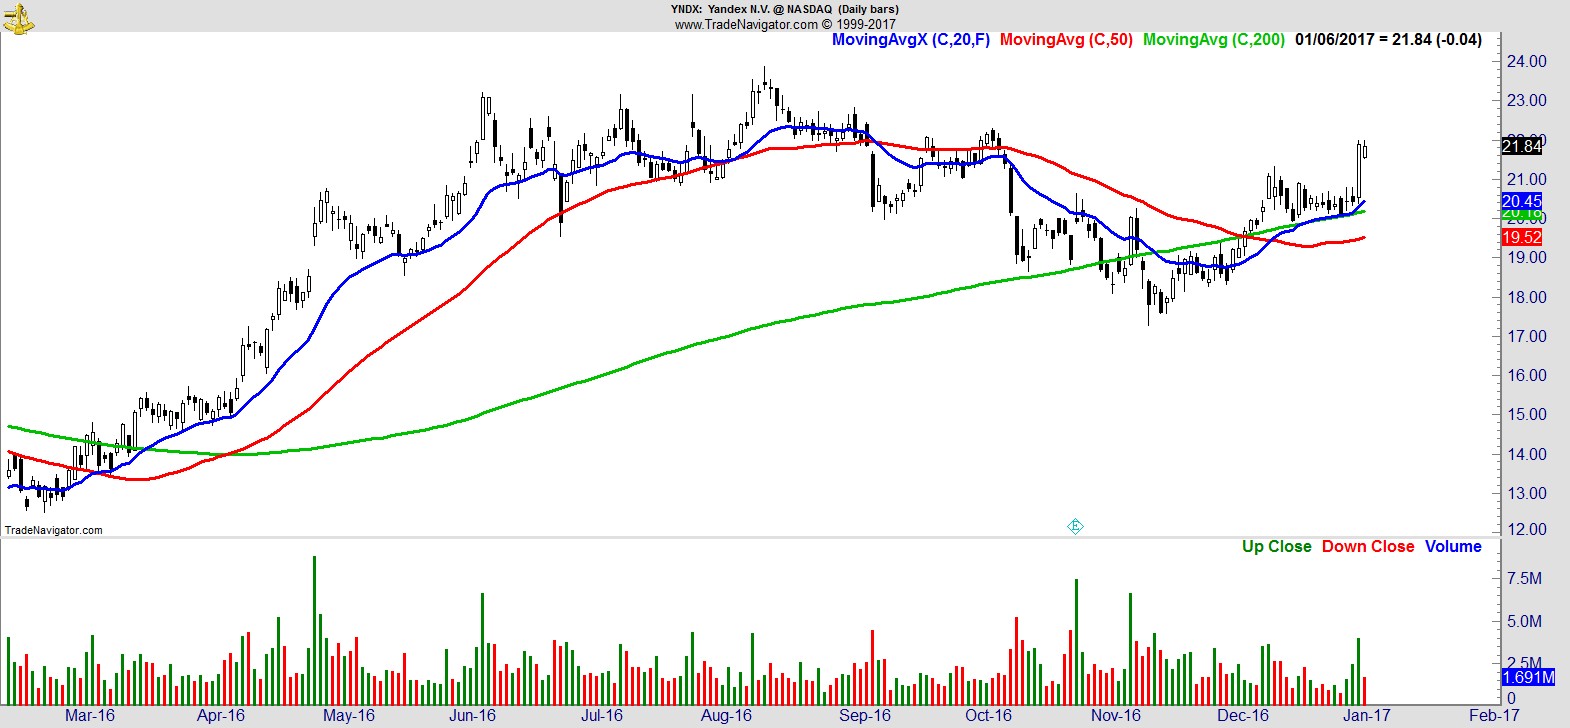
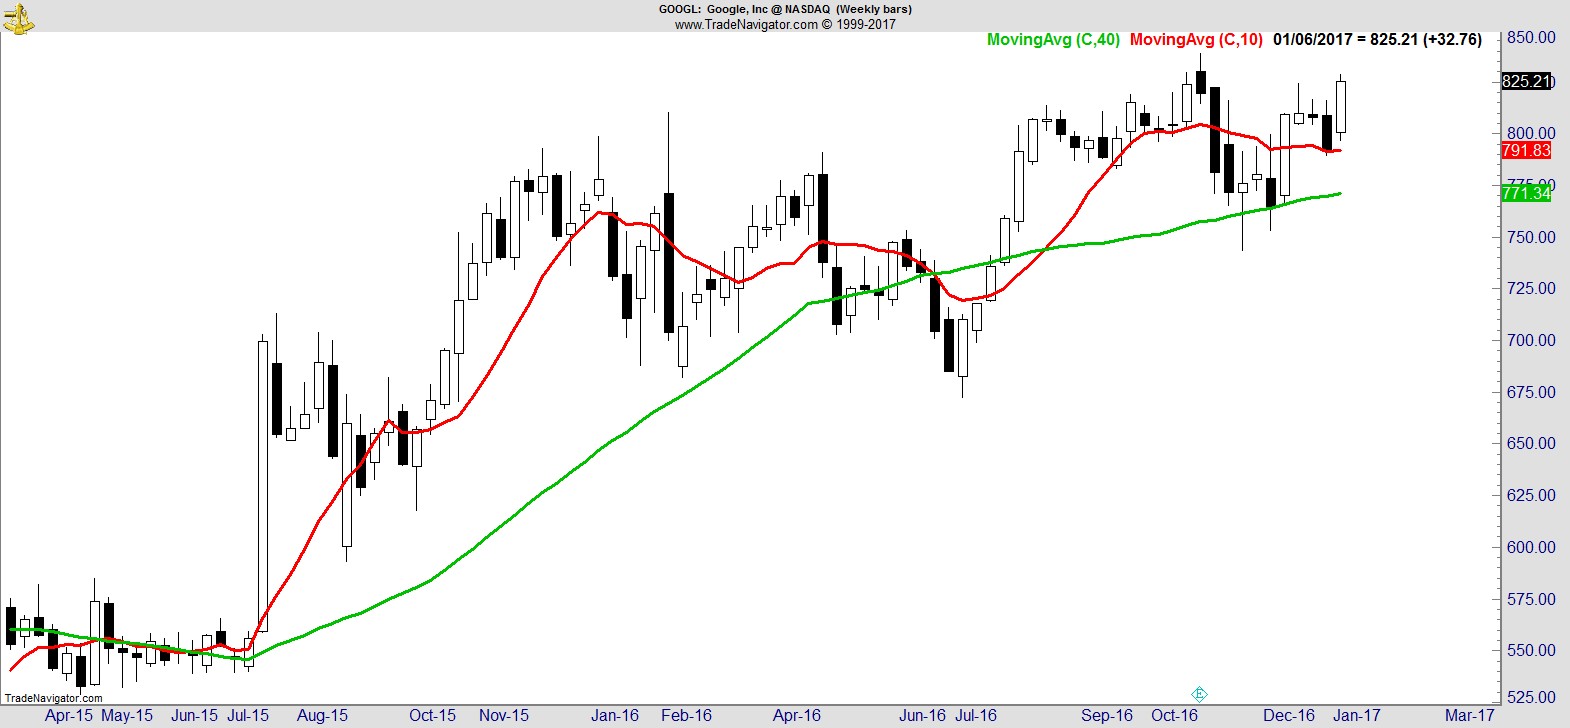
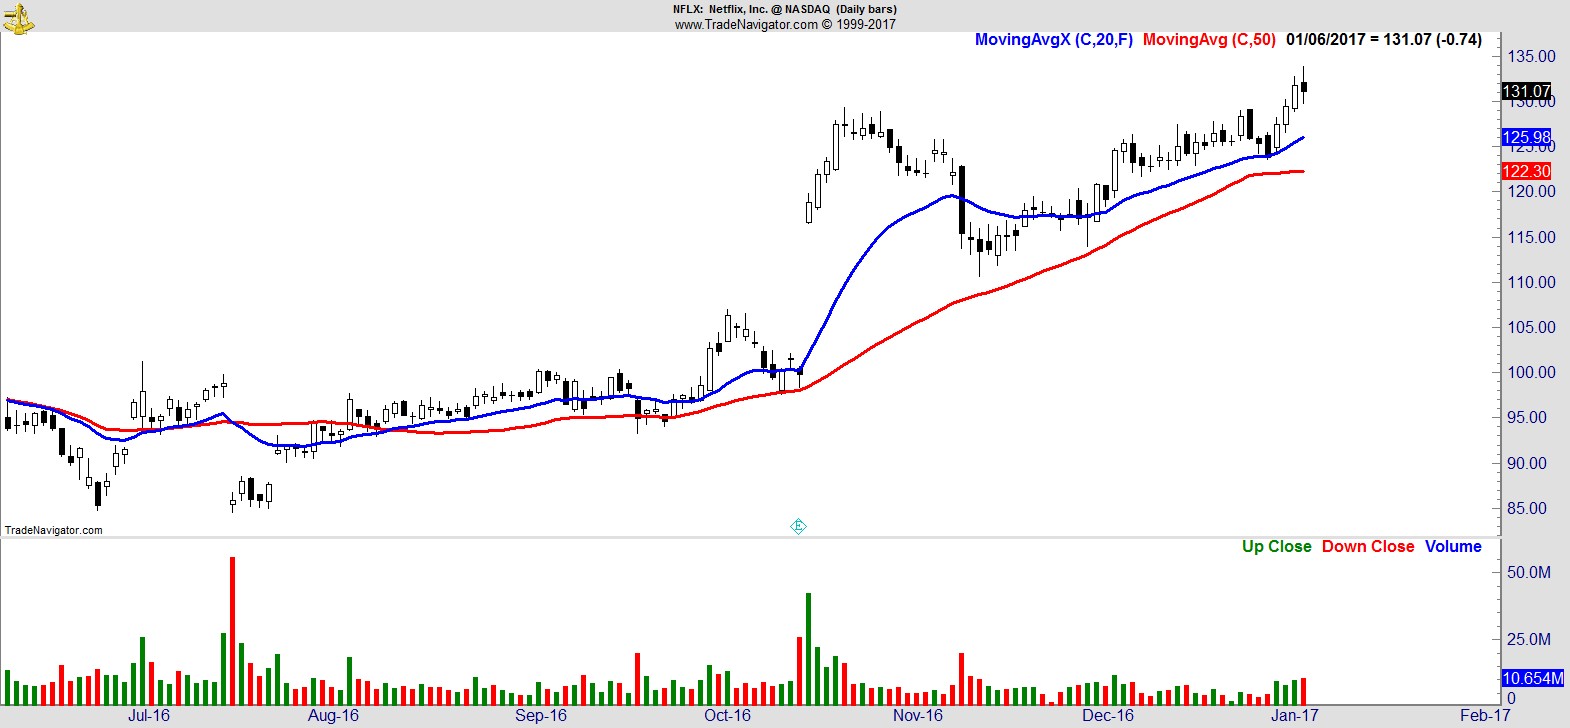
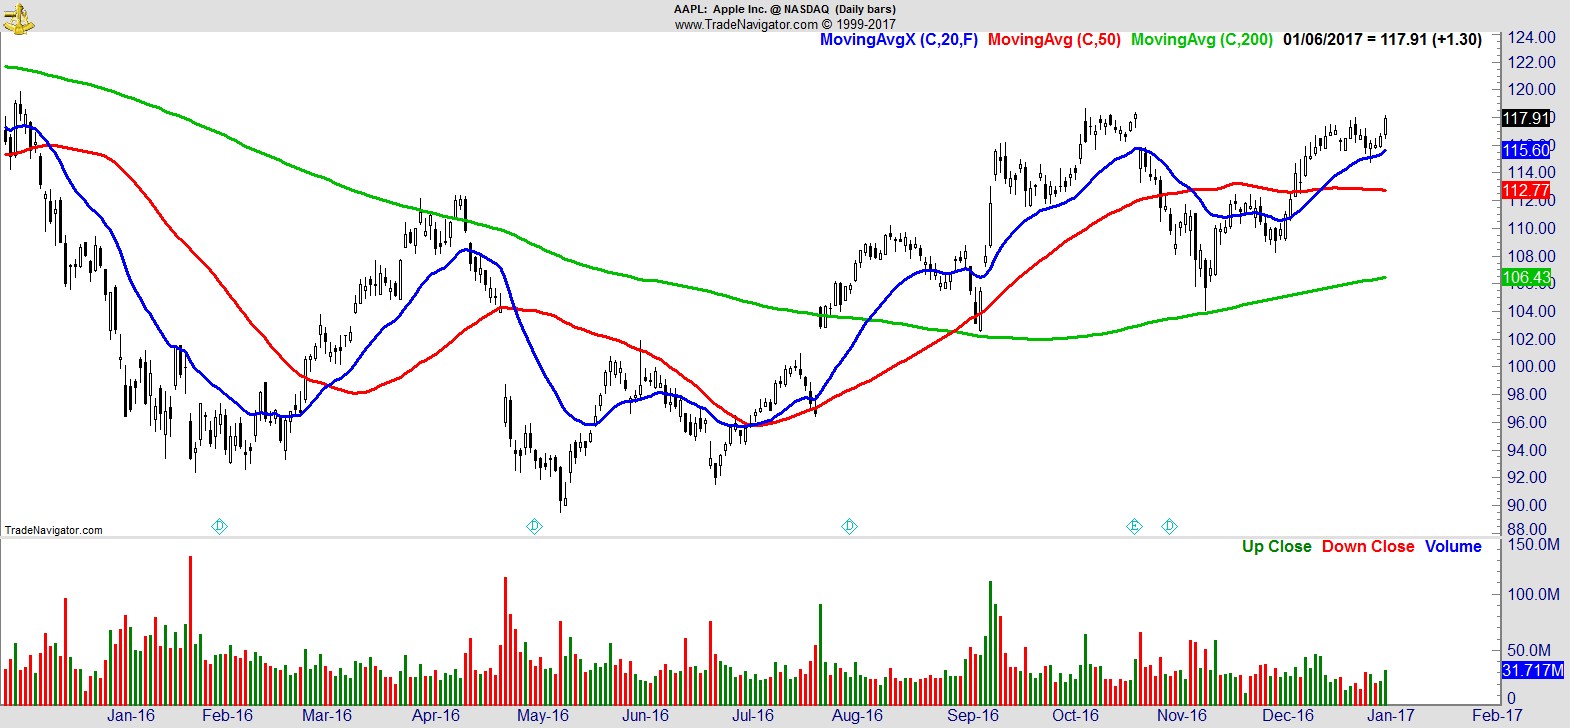
The main change in this week's list is the resurgence of tech names, especially some of the heavyweight index names, helping to push the sector to all time highs along with the NASDAQ. There are still strong showings from financial, industrial, energy, and consumer discretionary too.
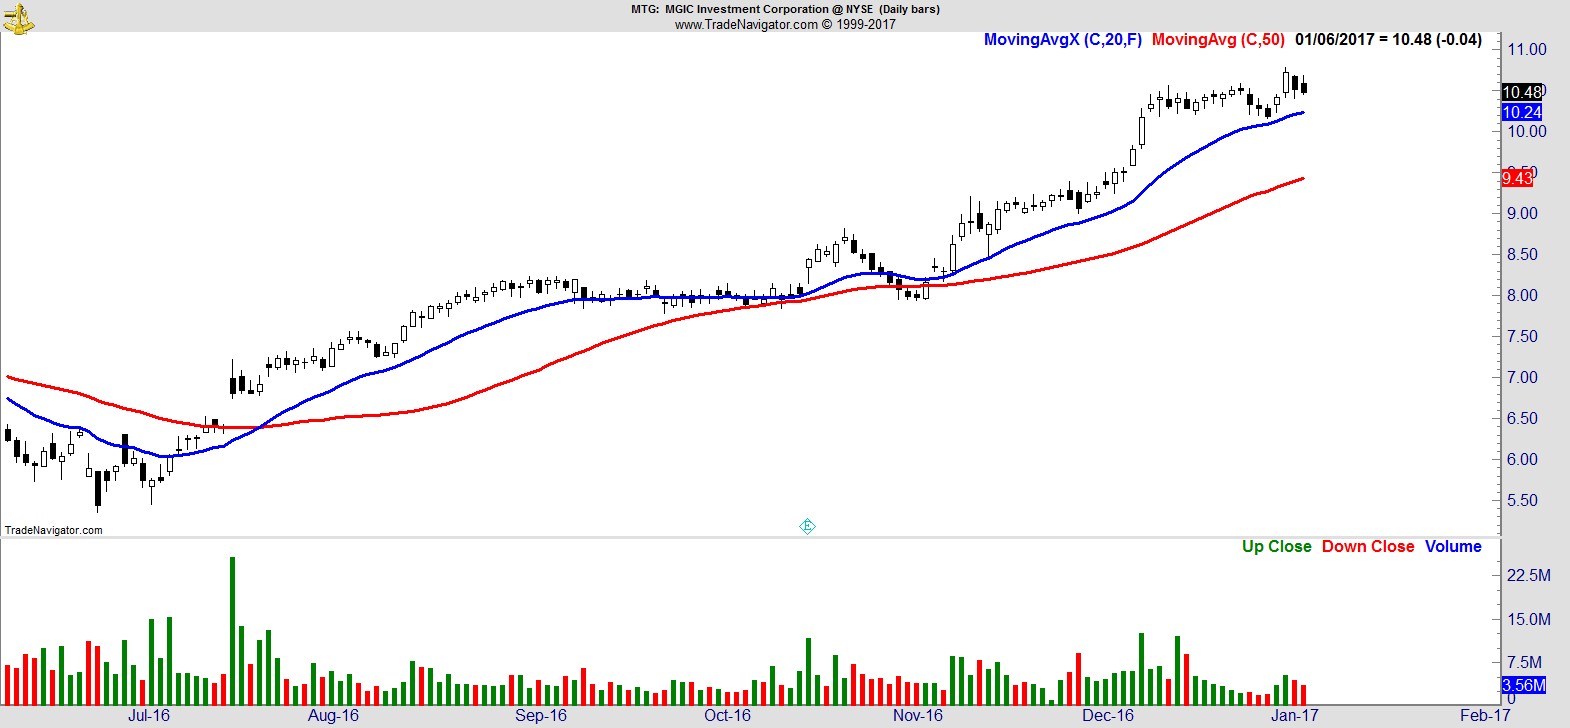
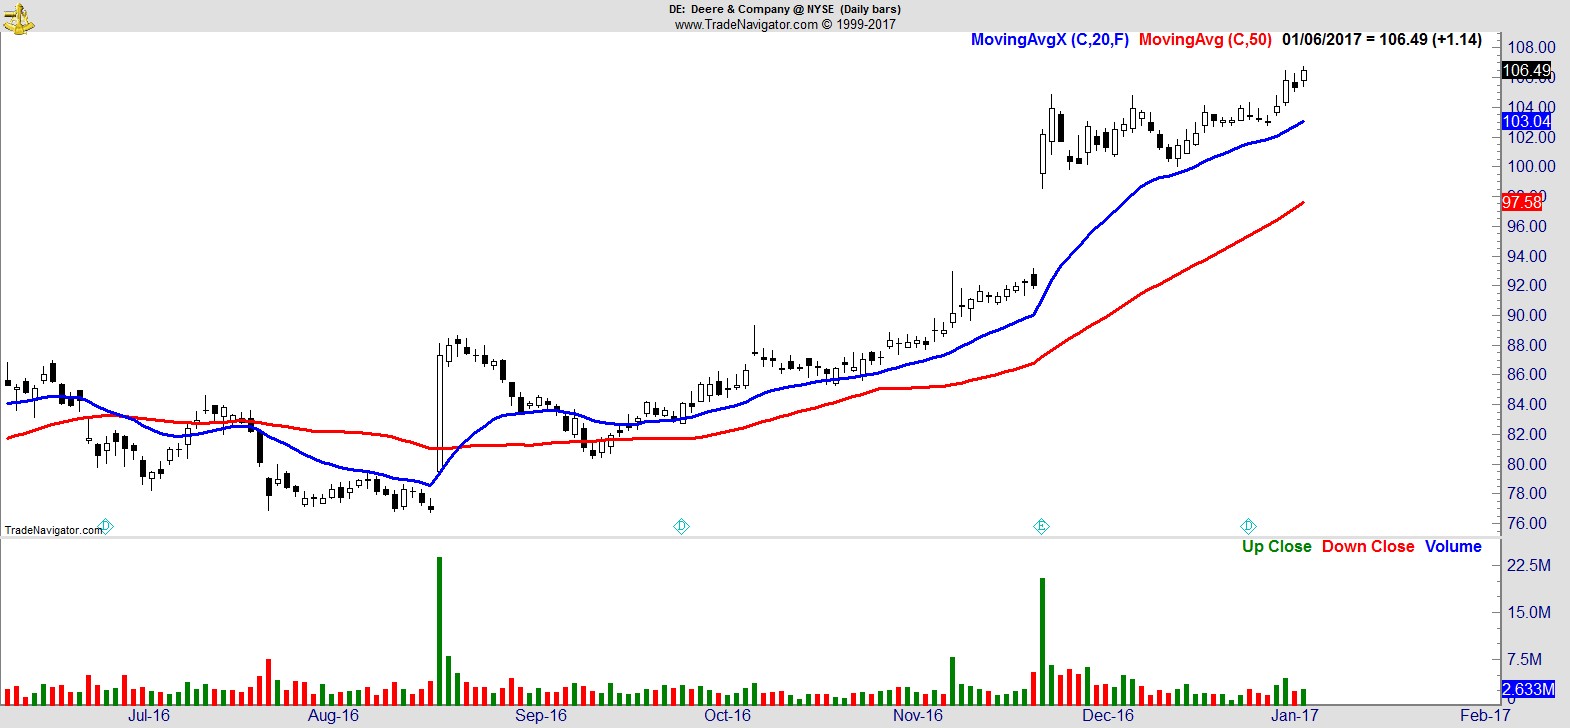
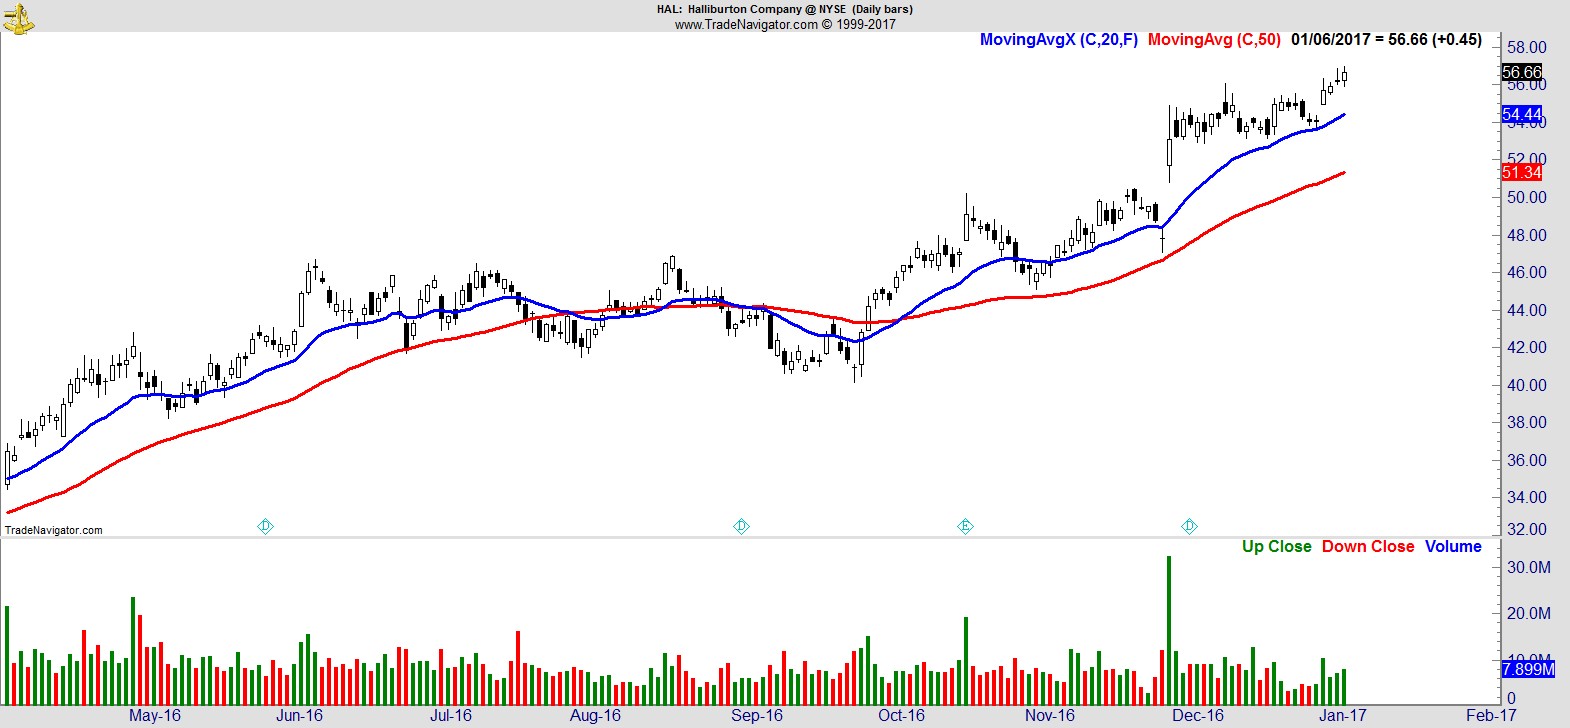
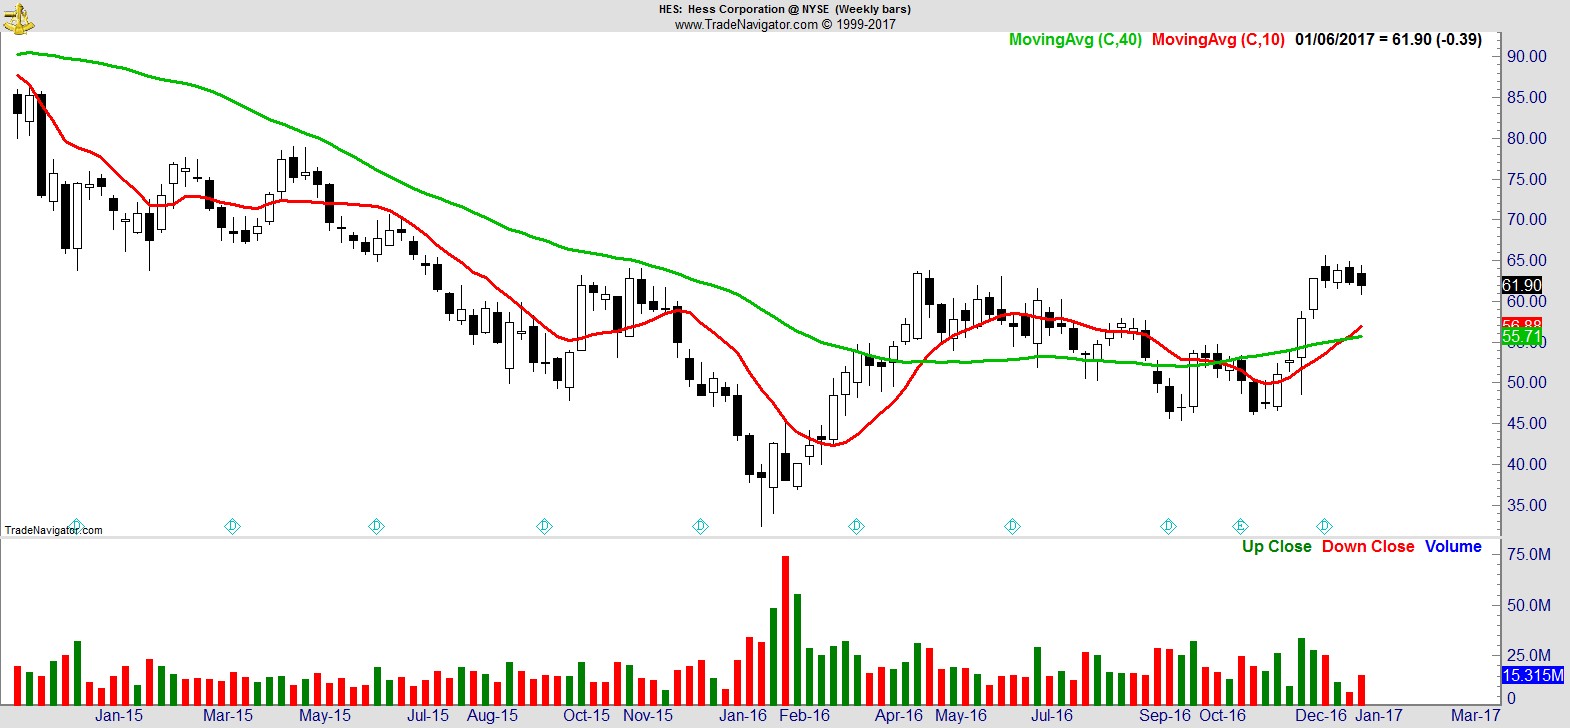
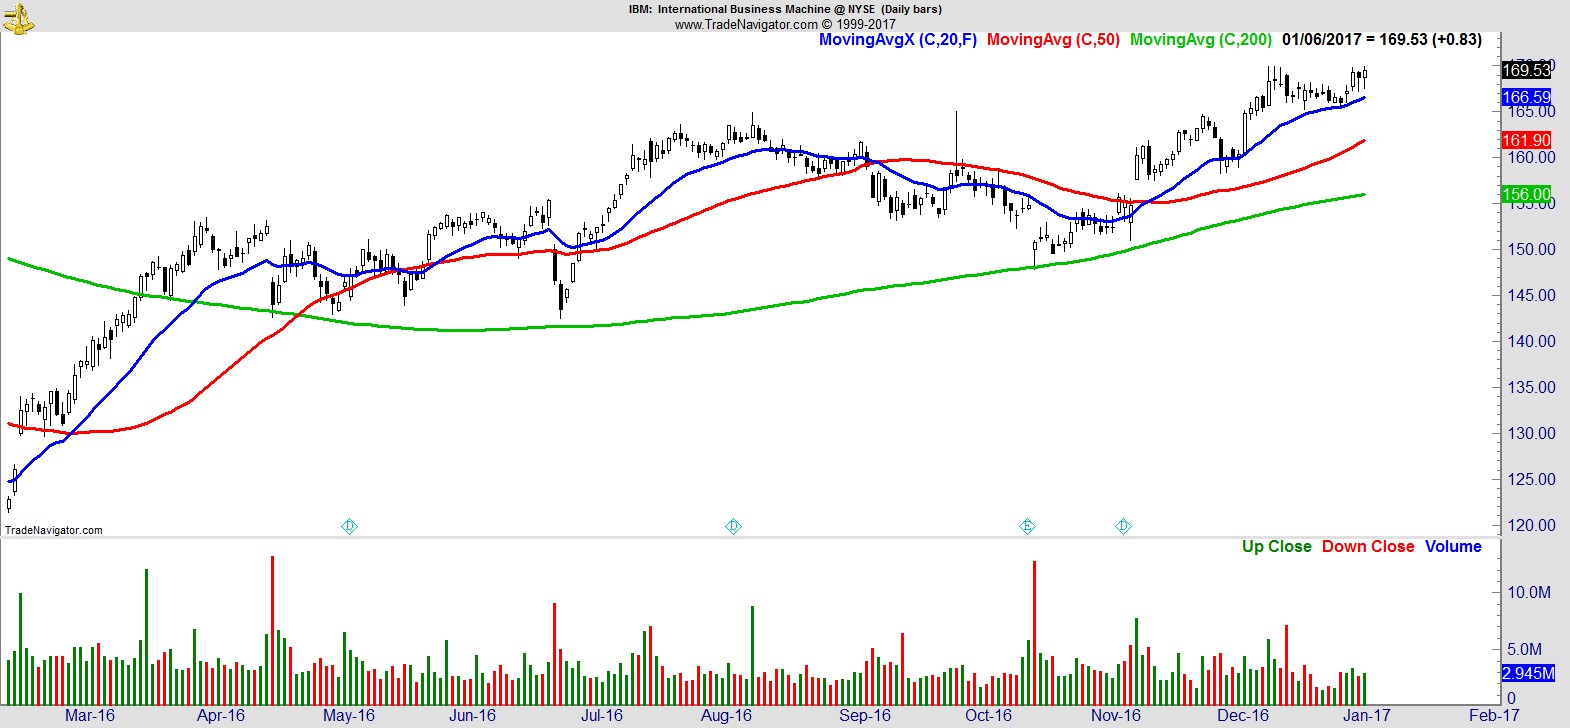
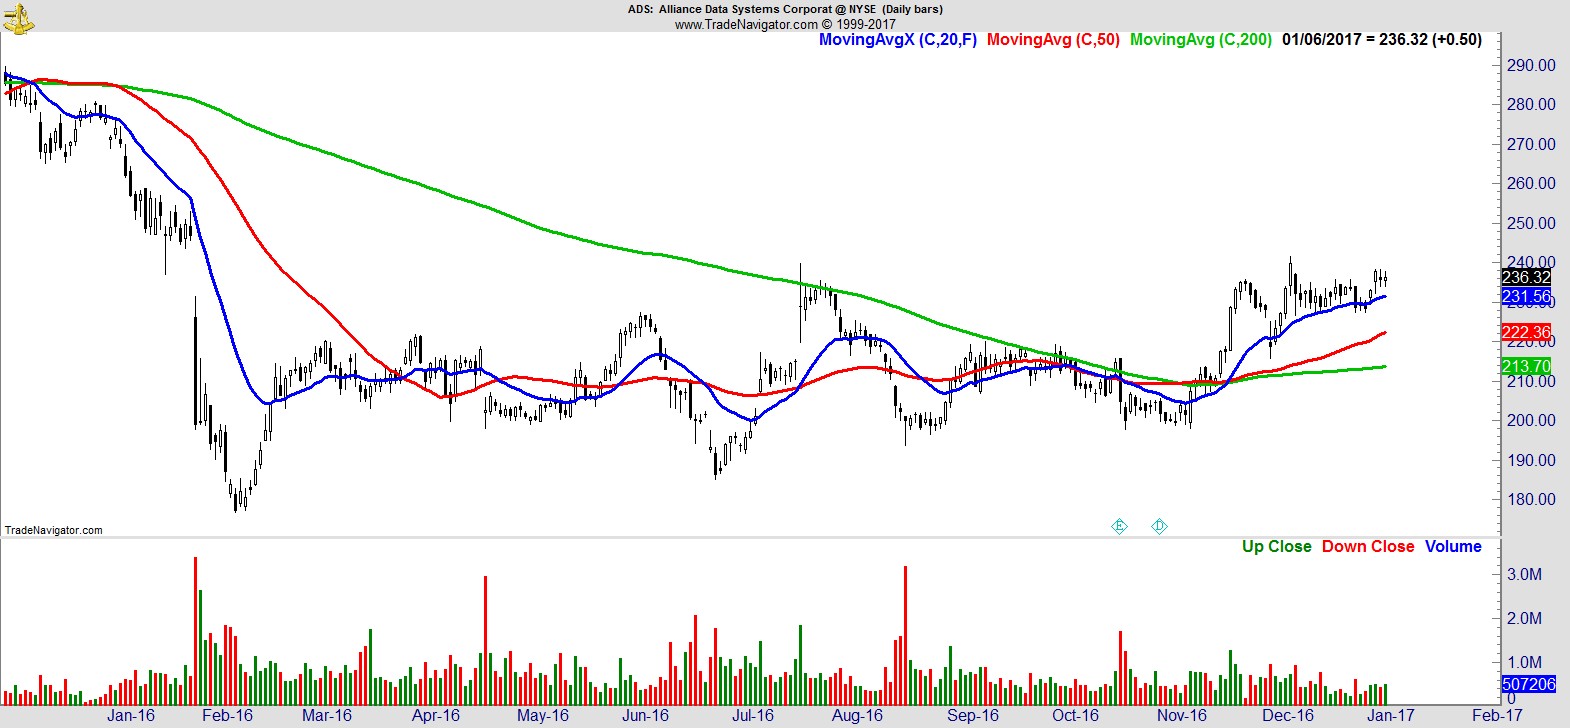
Here's a sample of 12 names:-
$MTG
.
$DE
.
$HAL
.
$HES
.
$IBM
.
$ADS
.
$YNDX
.
$GOOGL
.
$NFLX
.
$AAPL
.
$AMZN

.
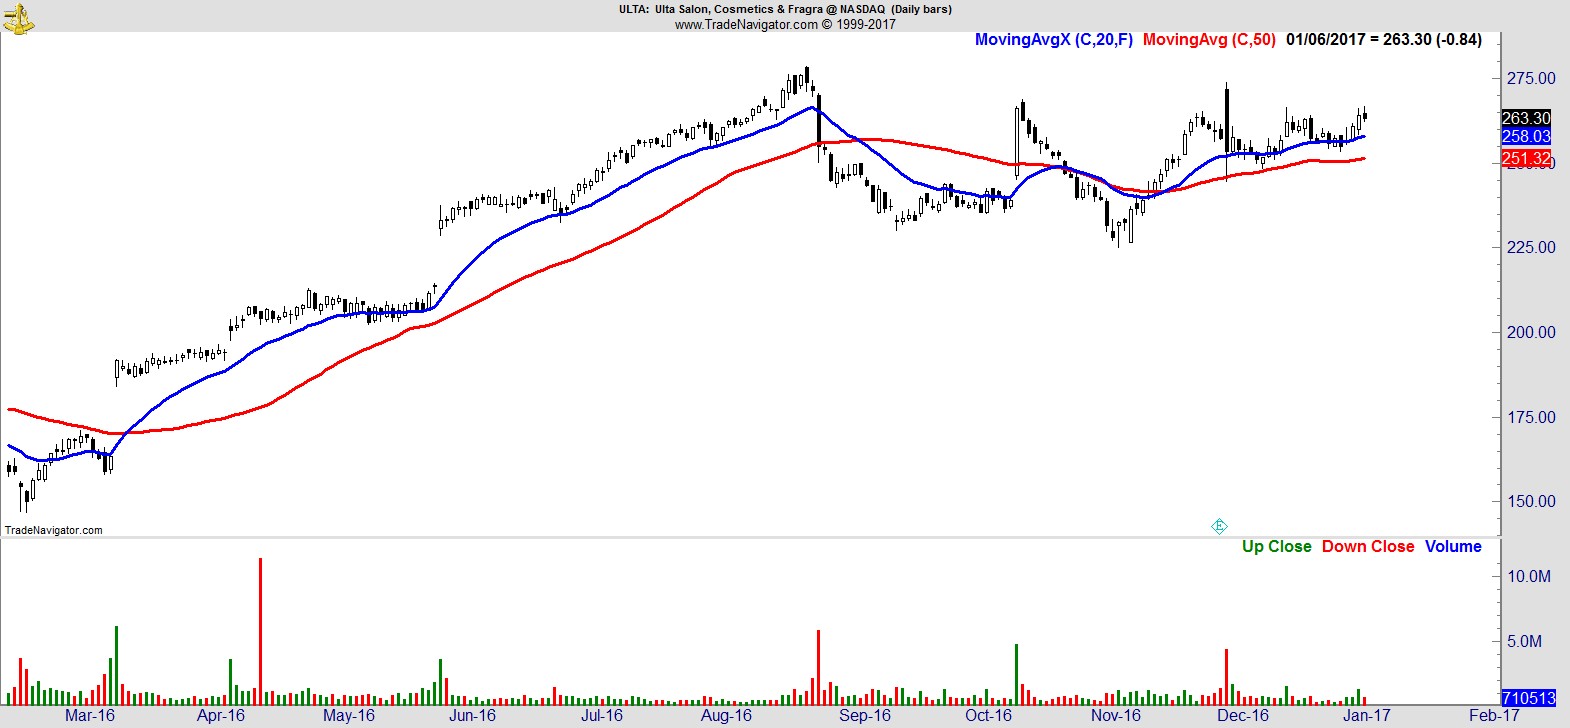
$ULTA
.
Recent free content from Jon Boorman
-
 Weekend Review and Watchlist
— 9/30/17
Weekend Review and Watchlist
— 9/30/17
-
Weekend Review and Watchlist
— 9/22/17
-
Weekend Review and Watchlist
— 9/17/17
-
Weekend Review and Watchlist
— 9/10/17
-
Weekend Review and Watchlist
— 9/02/17