

Understanding Alternatives - The Numbers
Stocks appear to be waffling a bit lower in the early going this morning with most of the focus on the happenings in Washington. And with traders waiting for the earnings parade to begin, this appears to be a good time to continue our exploration into the "alts" - I.E. alternative investing strategies.
To be sure, the alt space has been hyped as the next big thing in the investment business. The idea is to utilize both alternative asset classes as well as alternative approaches to traditional asset classes in one's portfolio. The goal is to produce returns that are purported to be uncorrelated to the stock and bond markets. Sounds good, right?
I've often heard the category referred to as the "last frontier of investing. But to be fair, the idea of putting some "diversifiers" into one's portfolios is actually as old as the hills.
In the old days, investors would carve out a small portion of their portfolios and include some gold. Then as time passed, commodities were included in the mix. And then REITs became a popular alternative - so popular in fact that the category now has its own S&P 500 sector.
More recently though, the alt space has expanded into untraditional areas such as L/S Equity, Managed Futures, Options, Arbitrage, etc.
So, for starters, I wanted to explore how what I call the traditional alts compared to the standard asset classes – i.e. the stock and bond markets. I wondered why investors had strayed from the old-school alts and over time have embraced all the sophisticated new-age alt strategies.
The Old-School Alts
I first looked at how an equally weighted combination of the "traditional alts" would have fared over a period of time and compared them to the traditional stock and bond markets, as well as the good 'ol 60/40.
In the table below, I use the Vanguard REIT ETF (VNQ) as a proxy for REITS, the Powershares DB Commodity Index ETF (DBC) as a proxy for commodities, and the SPDR Gold ETF (GLD) as a proxy for the gold market.
Traditional Alternatives 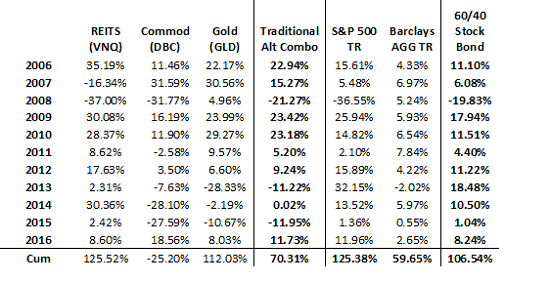
View Larger Image
Don't look now fans, but REITs provided a cumulative return slightly better than the S&P 500 and the GLD's return wasn't too far off the pace. And both beat the venerable 60/40 stock/bond allocation. Not bad.
But, man alive, look at the commodities returns. Can you say U-G-L-Y?
Since I am a big believer in diversification by methodology, strategy, manager, and time-frame, I naturally combinded the three categories to see how a diversified approach might look. The combination of REITS, Commodities and Gold would have produced a cumulative return of +70.31% over the period shown. This despite the brutal bear markets that occurred with all three classes during the period.
While the ride would have been exceptionally bumpy in 2013-2015 due to the collapse in oil prices, I did note that the traditional alt combo would have outperformed the bond market (Barclays Aggregate Bond Total Return) over the period. However, the combo did not outpace stocks or a 60/40 allocation.
At first blush, it would appear that a combination of these traditional alternatives was worthy of consideration for investors. However, if one looks closely at the returns, the issues become clear.
First, REITS and Commodities did not provide diversification benefits in 2008 as both proxies fell precipitously. No, only gold and bonds did their jobs during the credit crisis bear market.
In addition, take a look at the returns of the DBC and GLD from 2011 forward. Ouch. With the DBC showing a cumulative return of -25.2% over the 11-year period and gold losing -21% since 2011, it is little wonder that investors began to look for alternatives to the traditional alternatives!
The Next Generation of Alternatives
With this base-level assessment in hand, I then wanted to explore what I will call the new-age alternative categories. I found that Morningstar has a Multialternative Category benchmark and a Long-Short Equity Category benchmark that are published back to 2006. I also found that Credit Suisse has a Managed Futures Index that began in 2011. As such, I felt these provided solid representation of the various classes of new-age alts.
Here are the numbers...
Morningstar Category Returns 
View Larger Image
In reviewing the returns of these benchmarks through the end of 2016, the eye-opener for me was the realization that the performance of both the Morningstar Multialternative Category Benchmark and the Morningstar L/S Equity Benchmark is shockingly weak.
Since 2006, the cumulative return for the Morningstar Multialternative Category is just +11.59% and the return for Morningstar L/S Equity Benchmark is +31.71%. Compare this to the results of traditional asset classes over the same time frame: S&P 500 TR +125.4%, Barclays AGG +59.7%.
However, I knew that there was more to the new-age alt space than these two categories. So, I then added the managed futures into the mix.
On the surface, this class sounds like it would have promise as managers can literally invest in just about anything. And since the managers also purportedly have the ability to sidestep the stuff that isn't working, this particular area of the alt space has received an awful lot of hype.
In the table below, I have used the CS Managed Futures Index published in Morningstar as a proxy for the space.
New-Age Alternatives 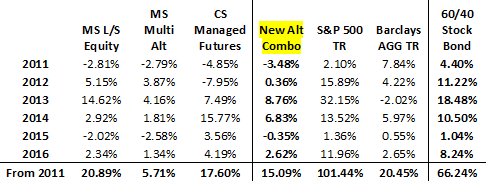
View Larger Image
Unfortunately, for the six-year period from 2011 through 2016 (chosen due to the inception date of the CS Managed Futures benchmark), the returns were not significantly different from the other two categories. Bummer.
I also created a combination of the three new-age categories in order to see if some diversification might help. Alas, all three categories plus the combo underperformed stocks and 60/40 by a wide margin.
However, this is not the end of the story. Remember, alt returns are supposed to be uncorrelated to the stock market and should help investor weather storms. In addition, many alt experts contend that alts should really be viewed/used as alternatives to bonds. So, tomorrow we will continue our exploration.
At the time of publication, Mr. Moenning and/or Sowell Management Services portfolios held positions in the following securities mentioned: GLD, VNQ. Positions are subject to change and may be bought or sold at any time.
Current Market Drivers
We strive to identify the driving forces behind the market action on a daily basis. The thinking is that if we can both identify and understand why stocks are doing what they are doing on a short-term basis; we are not likely to be surprised/blind-sided by a big move. Listed below are what we believe to be the driving forces of the current market (Listed in order of importance).
1. The State of the "Trump Trade"
2. The State of Global Central Bank Policies
3. The State of U.S. Economy
4. The State of Bond Yields
Thought For The Day:
The truth is that there is nothing noble in being superior to somebody else. The only real nobility is in being superior to your former self. - Whitney Young
Wishing you green screens and all the best for a great day,

David D. Moenning
Chief Investment Officer
Sowell Management Services
Looking for a "Modern" approach to Asset Allocation and Portfolio Design?
Looking for More on the State of the Markets?
Investment Pros: Looking to modernize your asset allocations, add risk management to client portfolios, or outsource portfolio design? Contact Eric@SowellManagement.com
Disclosures
The opinions and forecasts expressed herein are those of Mr. David Moenning and may not actually come to pass. Mr. Moenning's opinions and viewpoints regarding the future of the markets should not be construed as recommendations. The analysis and information in this report is for informational purposes only. No part of the material presented in this report is intended as an investment recommendation or investment advice. Neither the information nor any opinion expressed constitutes a solicitation to purchase or sell securities or any investment program.
Any investment decisions must in all cases be made by the reader or by his or her investment adviser. Do NOT ever purchase any security without doing sufficient research. There is no guarantee that the investment objectives outlined will actually come to pass. All opinions expressed herein are subject to change without notice. Neither the editor, employees, nor any of their affiliates shall have any liability for any loss sustained by anyone who has relied on the information provided.
The analysis provided is based on both technical and fundamental research and is provided "as is" without warranty of any kind, either expressed or implied. Although the information contained is derived from sources which are believed to be reliable, they cannot be guaranteed.
David D. Moenning is an investment adviser representative of Sowell Management Services, a registered investment advisor. For a complete description of investment risks, fees and services, review the firm brochure (ADV Part 2) which is available by contacting Sowell. Sowell is not registered as a broker-dealer.
Employees and affiliates of Sowell may at times have positions in the securities referred to and may make purchases or sales of these securities while publications are in circulation. Positions may change at any time.
Investments in equities carry an inherent element of risk including the potential for significant loss of principal. Past performance is not an indication of future results.
Advisory services are offered through Sowell Management Services.
Recent free content from FrontRange Trading Co.
-
 Is The Bull Argument Too Easy These Days?
— 8/31/20
Is The Bull Argument Too Easy These Days?
— 8/31/20
-
What Do The Cycles Say About 2020?
— 1/21/20
-
Modeling 2020 Expectations (Just For Fun)
— 1/13/20
-
Tips From Real-World Wendy Rhoades
— 5/06/19
-
The Best Recession Ever!
— 4/29/19
-
{[comment.author.username]} {[comment.author.username]} — Marketfy Staff — Maven — Member


- 1 Campus Martius, Suite #200Detroit, MI 48226
- +1 877 440 9464