

Colors Changing on the Indicator Boards
Good Monday morning and welcome back. The focus of the market this morning includes the state of Trump policies, the dollar, and rates. And with stocks currently stuck in a tight range, it will be interesting to see which way traders decide to go in the near term. But before we start down the prognostication trail on what might happen next, let's check in with my favorite models and indicators.
The State of the Trend
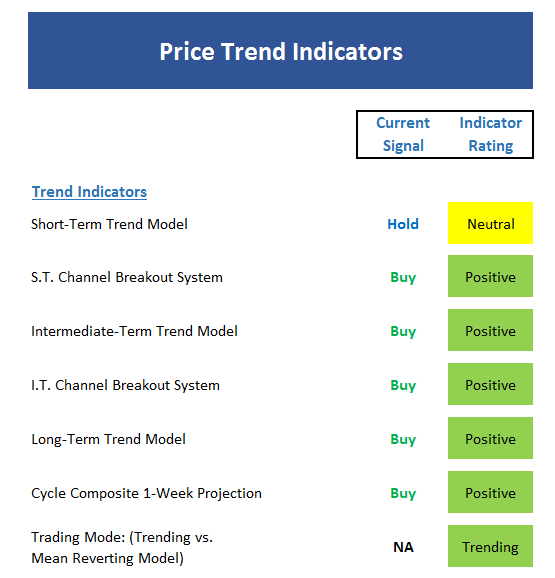
We start with a look at the "state of the trend" from our objective indicator panel. These indicators are designed to give us a feel for the overall health of the current short- and intermediate-term trend models.
Executive Summary:
- At first glance, it would appear that the state of the trend is positive
- However, stocks have been moving sideways in a tight range now for six weeks and it wouldn't take much downside pressure to shake all that green off of the board
- The short-term trend model is the first to flip to neutral
- The cycle composite projects higher prices for the next two weeks
- The trading mode models still suggest a trending market, but the indicators have weakened
- This is the time when I defer to momentum and early warning indicators for a true sense of the environment
The State of Internal Momentum
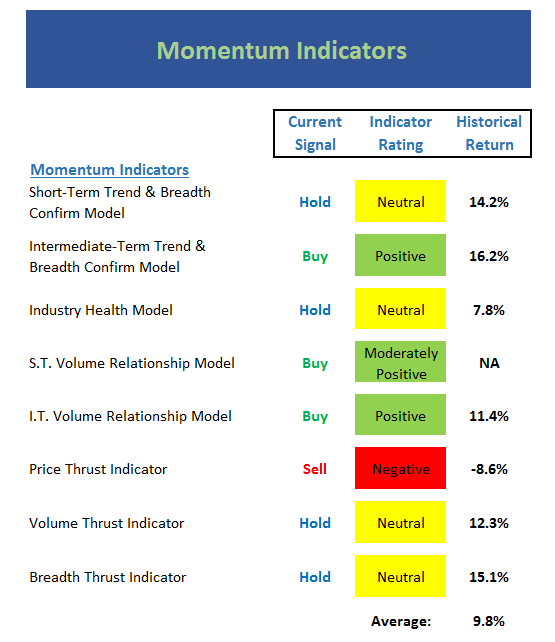
Now we turn to the momentum indicators...
Executive Summary:
- While not in bad shape, the momentum board is starting to look tired
- Short-term Trend & Breadth model is now neutral
- The Industry Health model also fell back to neutral zone
- The short-term Volume Relationship model has been downgraded to moderately positive and is moving in the wrong direction
- The intermediate-term Volume Relationship model remains positive but is starting to roll over
- The Price Thrust indicator moved to negative due to the length of time stocks have been moving sideways
- The historical returns of the board in the current mode is in line with the long-term averages
The State of the "Trade"
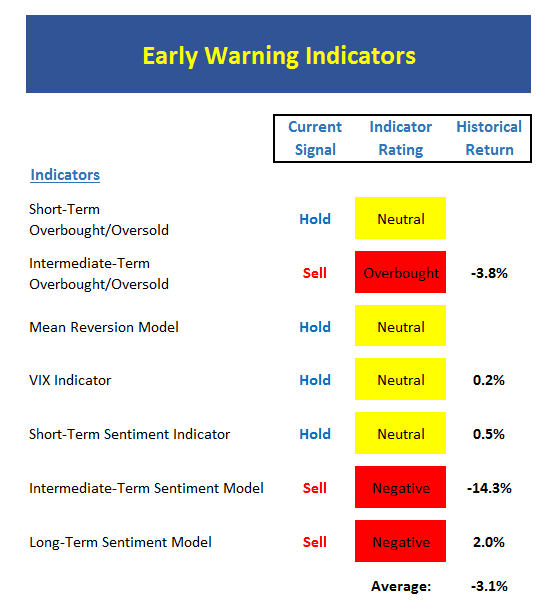
Next up is the "early warning" board, which is designed to indicate when traders may start to "go the other way" -- for a trade.
Executive Summary:
- The overall coloring of the board says it all
- From a short-term perspective, overbought/sold indicators are mixed
- Stocks are overbought from both intermediate- and long-term perspectives
- The VIX indicator is currently in no man's-land
- The short-term Sentiment model creeped up to the neutral zone, but by the skinniest of margins
- The rest of the sentiment models remain negative
- One of longest-term sentiment models (not shown) gave a rare sell signal recently - the first since 2012
- Although stocks can get overbought and stay overbought in strong uptrends, the early warning board suggests some caution is warranted in the near-term
The State of the Macro Picture
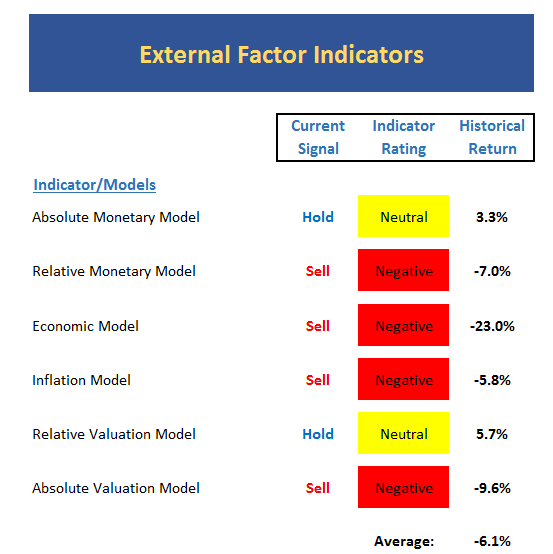
Now let's move on to the market's "external factors" - the indicators designed to tell us the state of the big-picture market drivers including monetary conditions, the economy, inflation, and valuations.
Executive Summary:
- Until just recently, this board was largely positive on balance. Now it is negative.
- The absolute Monetary model continues to move lower into the neutral zone
- The relative Monetary model remains negative
- The combination of the Monetary models suggests that monetary conditions are now a headwind
- The Economic model designed to "call" the stock market continues to sink
- The Inflation model moved to negative reading - recall that Y/Y inflation figures came in above Fed's target level recently
- Relative Valuation Model moved to neutral - first time since 2009
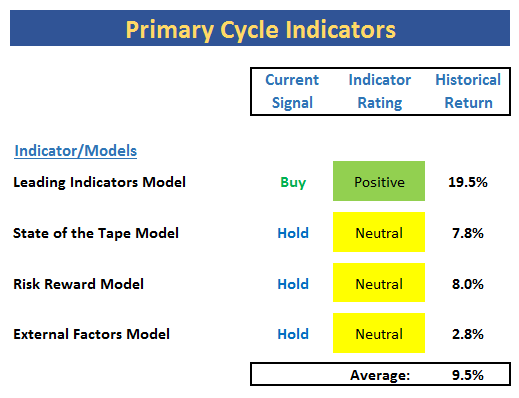
The State of the Big-Picture Market Models
Finally, let's review our favorite big-picture market models, which are designed to tell us which team is in control of the prevailing major trend.
Executive Summary:
- My favorite big-picture models are largely neutral at the present time
- The Leading Indicators model remains positive. Recall that this model did a fine job calling the starts of both the mini-bear and the current bull cycles
- The Risk/Reward model is neutral and is being held down by current monetary conditions
- The State of the Tape model is at the high end of neutral
- The External Factors model is also neutral
- While the board is largely yellow, the historical return average remains near long-term trend (and is being supported by the positive reading of the Leading Indicators model
The Takeaway...
It is one thing for a market to pause after a strong run-up. And after the impressive blast that occurred from November 7th forward, the bulls have certainly earned a rest. But it is another thing for internal weakness to develop during the pause. And it is yet another for long-term, big-picture models to turn red. As such, the indicators would seem to suggest that the bears may be set up for an opportunity to run with the ball for a while. However, so far at least, all the dips have been bought. So, while stocks would seem to be vulnerable near-term, leaning bullish still makes sense from an intermediate-term perspective.
Current Market Drivers
We strive to identify the driving forces behind the market action on a daily basis. The thinking is that if we can both identify and understand why stocks are doing what they are doing on a short-term basis; we are not likely to be surprised/blind-sided by a big move. Listed below are what we believe to be the driving forces of the current market (Listed in order of importance).
1. The State of Trump Administration Policies
2. The State of the U.S. Economy
3. The State of Global Central Bank Policies
4. The State of Bond Yields
Thought For The Day:
You can discover what your enemy fears most by observing the means he uses to frighten you. - Eric Hoffer
Wishing you green screens and all the best for a great day,

David D. Moenning
Chief Investment Officer
Sowell Management Services
Looking for a "Modern" approach to Asset Allocation and Portfolio Design?
Looking for More on the State of the Markets?
Investment Pros: Looking to modernize your asset allocations, add risk management to client portfolios, or outsource portfolio Management? Contact Eric@SowellManagement.com
Disclosures
The opinions and forecasts expressed herein are those of Mr. David Moenning and may not actually come to pass. Mr. Moenning's opinions and viewpoints regarding the future of the markets should not be construed as recommendations. The analysis and information in this report is for informational purposes only. No part of the material presented in this report is intended as an investment recommendation or investment advice. Neither the information nor any opinion expressed constitutes a solicitation to purchase or sell securities or any investment program.
Any investment decisions must in all cases be made by the reader or by his or her investment adviser. Do NOT ever purchase any security without doing sufficient research. There is no guarantee that the investment objectives outlined will actually come to pass. All opinions expressed herein are subject to change without notice. Neither the editor, employees, nor any of their affiliates shall have any liability for any loss sustained by anyone who has relied on the information provided.
The analysis provided is based on both technical and fundamental research and is provided "as is" without warranty of any kind, either expressed or implied. Although the information contained is derived from sources which are believed to be reliable, they cannot be guaranteed.
David D. Moenning is an investment adviser representative of Sowell Management Services, a registered investment advisor. For a complete description of investment risks, fees and services, review the firm brochure (ADV Part 2) which is available by contacting Sowell. Sowell is not registered as a broker-dealer.
Employees and affiliates of Sowell may at times have positions in the securities referred to and may make purchases or sales of these securities while publications are in circulation. Positions may change at any time.
Investments in equities carry an inherent element of risk including the potential for significant loss of principal. Past performance is not an indication of future results.
Advisory services are offered through Sowell Management Services.
Recent free content from FrontRange Trading Co.
-
 Is The Bull Argument Too Easy These Days?
— 8/31/20
Is The Bull Argument Too Easy These Days?
— 8/31/20
-
What Do The Cycles Say About 2020?
— 1/21/20
-
Modeling 2020 Expectations (Just For Fun)
— 1/13/20
-
Tips From Real-World Wendy Rhoades
— 5/06/19
-
The Best Recession Ever!
— 4/29/19
-
{[comment.author.username]} {[comment.author.username]} — Marketfy Staff — Maven — Member


- 1 Campus Martius, Suite #200Detroit, MI 48226
- +1 877 440 9464