

When Will It End?
With major stock indices finishing at new all-time highs for a third consecutive session, the question of the day would appear to be, when will it end?
The tenacious rally that began just before the November election, has now lifted the S&P 500 by 11.7%, the DJIA by 14.1%, the NASDAQ Composite by 14.2%, and the Russell 2000 by 20.3% - all in a little over three months. And given that the average annual return for the stock market since 1900 is something on the order of 10%, one can't be blamed for wondering if the market has gone too far, too fast, and is ready for a rest.
There can be no denying that stocks are currently overbought or that sentiment readings have become more than a little optimistic of late. As such, short-term traders are starting to lick their chops at the opportunity for a quick reversal to the downside. But as someone who has seen these types of moves before, my personal view is, good luck with that.
S&P 500 - Daily 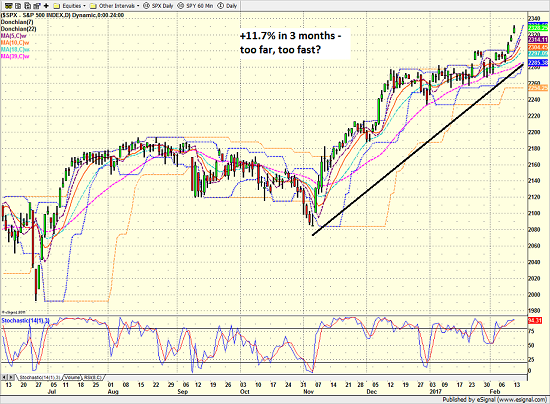
View Larger Image
Frankly, I'm not too concerned about a near-term pullback at this stage of the game. Experience has taught me that while a market can embark on a countertrend move of 3-5% at any time - and for almost any reason - it's the bigger picture moves that really matter.
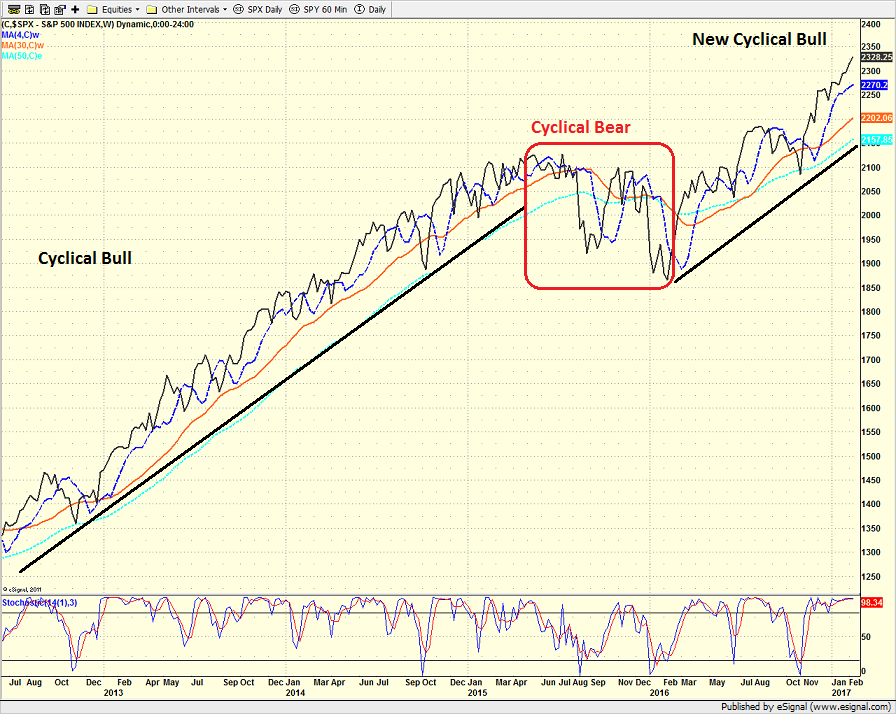
On that score, the bulls argue that the current market rally represents a "catch up" move after the prolonged period of sideways activity that began in early 2015 and the "mini" or cyclical bear market that occurred between August 2015 and February 2016.
S&P 500 - Weekly 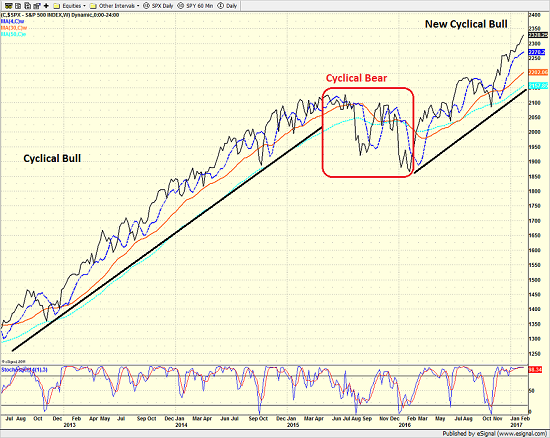
View Larger Image
From a bigger picture standpoint, our heroes in horns also contend that history is on their side. Exhibit A in their argument is the fact that the current cyclical bull has advanced 27.3% from the February 2016 low and yesterday's close. And given that, according to the computers at Ned Davis Research, the median gain for cyclical bull markets is about 77%, those seeing the market's glass as at least half-full contend that this bull may still have some room to roam.
Same Question, Different Bull
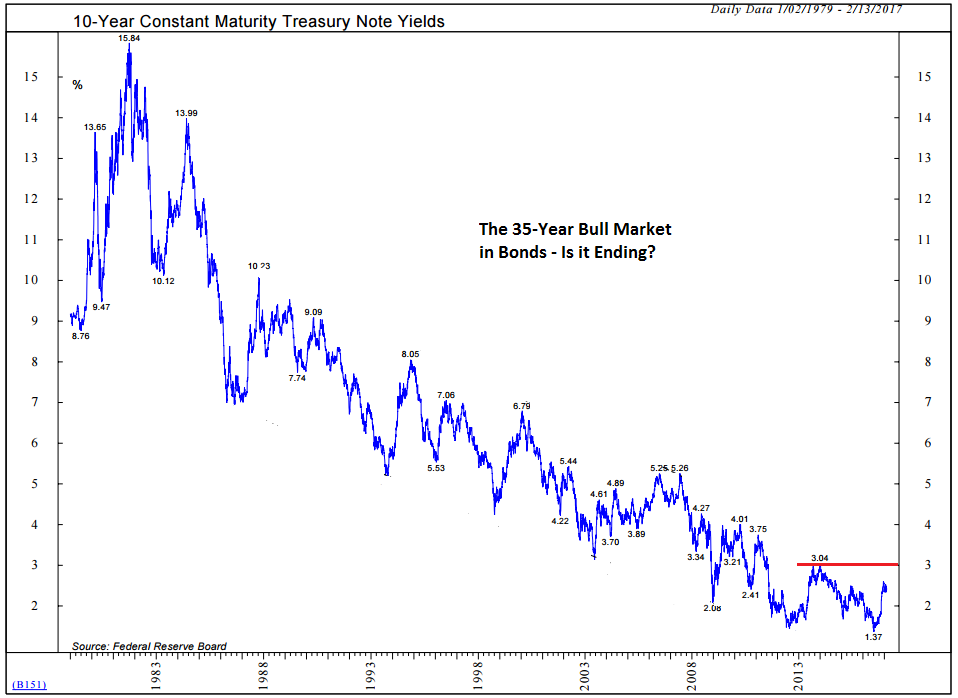
The question, "When will it end?" is also being applied to the bond market these days. As the chart below shows, yields have been moving from the upper left to the lower right from some 35 years now. In short, THIS is what a secular move looks like. (Remember that when yields fall, bond prices rise.)
10-Year Treasury Note Yield 
View Larger Image
Technicians tell us that if the yield on the 10-Year T-Note exceeds the "Taper Tantrum" high seen in 2013 of 3.04%, the tide will have turned and a new bear market will be born.
Given all the talk about an improving economy, higher inflation, and the Fed walking away from years of uber-easy monetary policy, it is natural to think that yields should move higher in the coming months and years. And as such, it is easy to hop on the bond bear train at this time from a macro perspective.
Follow The Money
However, before you give up on the dueling bulls of the stock and bond market, remember this - QE remains alive and well.
Lest we forget, the quantitative easing schemes of the world's central bankers effectively create capital on a monthly basis. And if we've learned anything in the aftermath of the financial crisis, it is that money goes where it is treated best, which, of course, has been the U.S. stock and bond markets for several years running.
So, before you run out and buy those leveraged inverse ETFs on the stock and bond market, consider that the ECB and BOJ are still effectively printing money every month. And in my opinion, until the QE game ends, there will continue to be support for BOTH the U.S. stock and bond markets.
So, until Super Mario or PM Abe start to publicly walk back their stimulutive monetary programs, it is probably a good idea to continue to "buy the dips" in the stock market and not to panic (yet) in the bond market.
Thought For The Day:
Never let success go to your head or defeat into your heart...
Current Market Drivers
We strive to identify the driving forces behind the market action on a daily basis. The thinking is that if we can both identify and understand why stocks are doing what they are doing on a short-term basis; we are not likely to be surprised/blind-sided by a big move. Listed below are what we believe to be the driving forces of the current market (Listed in order of importance).
1. The State of Trump Administration Policies
2. The State of the U.S. Economy
3. The State of Global Central Bank Policies
Wishing you green screens and all the best for a great day,

David D. Moenning
Chief Investment Officer
Sowell Management Services
Disclosure: At the time of publication, Mr. Moenning and/or Sowell Management Services held long positions in the following securities mentioned: none. Note that positions may change at any time.
Looking for a "Modern" approach to Asset Allocation and Portfolio Design?
Looking for More on the State of the Markets?
Investment Pros: Looking to modernize your asset allocations, add risk management to client portfolios, or outsource portfolio design? Contact Eric@SowellManagement.com
Disclosures
The opinions and forecasts expressed herein are those of Mr. David Moenning and may not actually come to pass. Mr. Moenning's opinions and viewpoints regarding the future of the markets should not be construed as recommendations. The analysis and information in this report is for informational purposes only. No part of the material presented in this report is intended as an investment recommendation or investment advice. Neither the information nor any opinion expressed constitutes a solicitation to purchase or sell securities or any investment program.
Any investment decisions must in all cases be made by the reader or by his or her investment adviser. Do NOT ever purchase any security without doing sufficient research. There is no guarantee that the investment objectives outlined will actually come to pass. All opinions expressed herein are subject to change without notice. Neither the editor, employees, nor any of their affiliates shall have any liability for any loss sustained by anyone who has relied on the information provided.
The analysis provided is based on both technical and fundamental research and is provided "as is" without warranty of any kind, either expressed or implied. Although the information contained is derived from sources which are believed to be reliable, they cannot be guaranteed.
David D. Moenning is an investment adviser representative of Sowell Management Services, a registered investment advisor. For a complete description of investment risks, fees and services, review the firm brochure (ADV Part 2) which is available by contacting Sowell. Sowell is not registered as a broker-dealer.
Employees and affiliates of Sowell may at times have positions in the securities referred to and may make purchases or sales of these securities while publications are in circulation. Positions may change at any time.
Investments in equities carry an inherent element of risk including the potential for significant loss of principal. Past performance is not an indication of future results.
Advisory services are offered through Sowell Management Services.
Recent free content from FrontRange Trading Co.
-
 Is The Bull Argument Too Easy These Days?
— 8/31/20
Is The Bull Argument Too Easy These Days?
— 8/31/20
-
What Do The Cycles Say About 2020?
— 1/21/20
-
Modeling 2020 Expectations (Just For Fun)
— 1/13/20
-
Tips From Real-World Wendy Rhoades
— 5/06/19
-
The Best Recession Ever!
— 4/29/19
-
{[comment.author.username]} {[comment.author.username]} — Marketfy Staff — Maven — Member


- 1 Campus Martius, Suite #200Detroit, MI 48226
- +1 877 440 9464