

Ignore What I Say - Listen to the Charts
If you have been keeping up to date with the government shutdown and my views on how it will affect the market you are aware that I feel we are in the midst of a buying opportunity. But that is simply my opinion, of course based on research and how the market has reacted in the past.
If you do not want to agree with my view, then I suggest you look at the charts. I have a couple of charts below showing how the market is pulling back to support and at the same time other technical indicators are turning extremely bullish. As I have stated many times, the Charts Do Not Lie. See for yourself below.
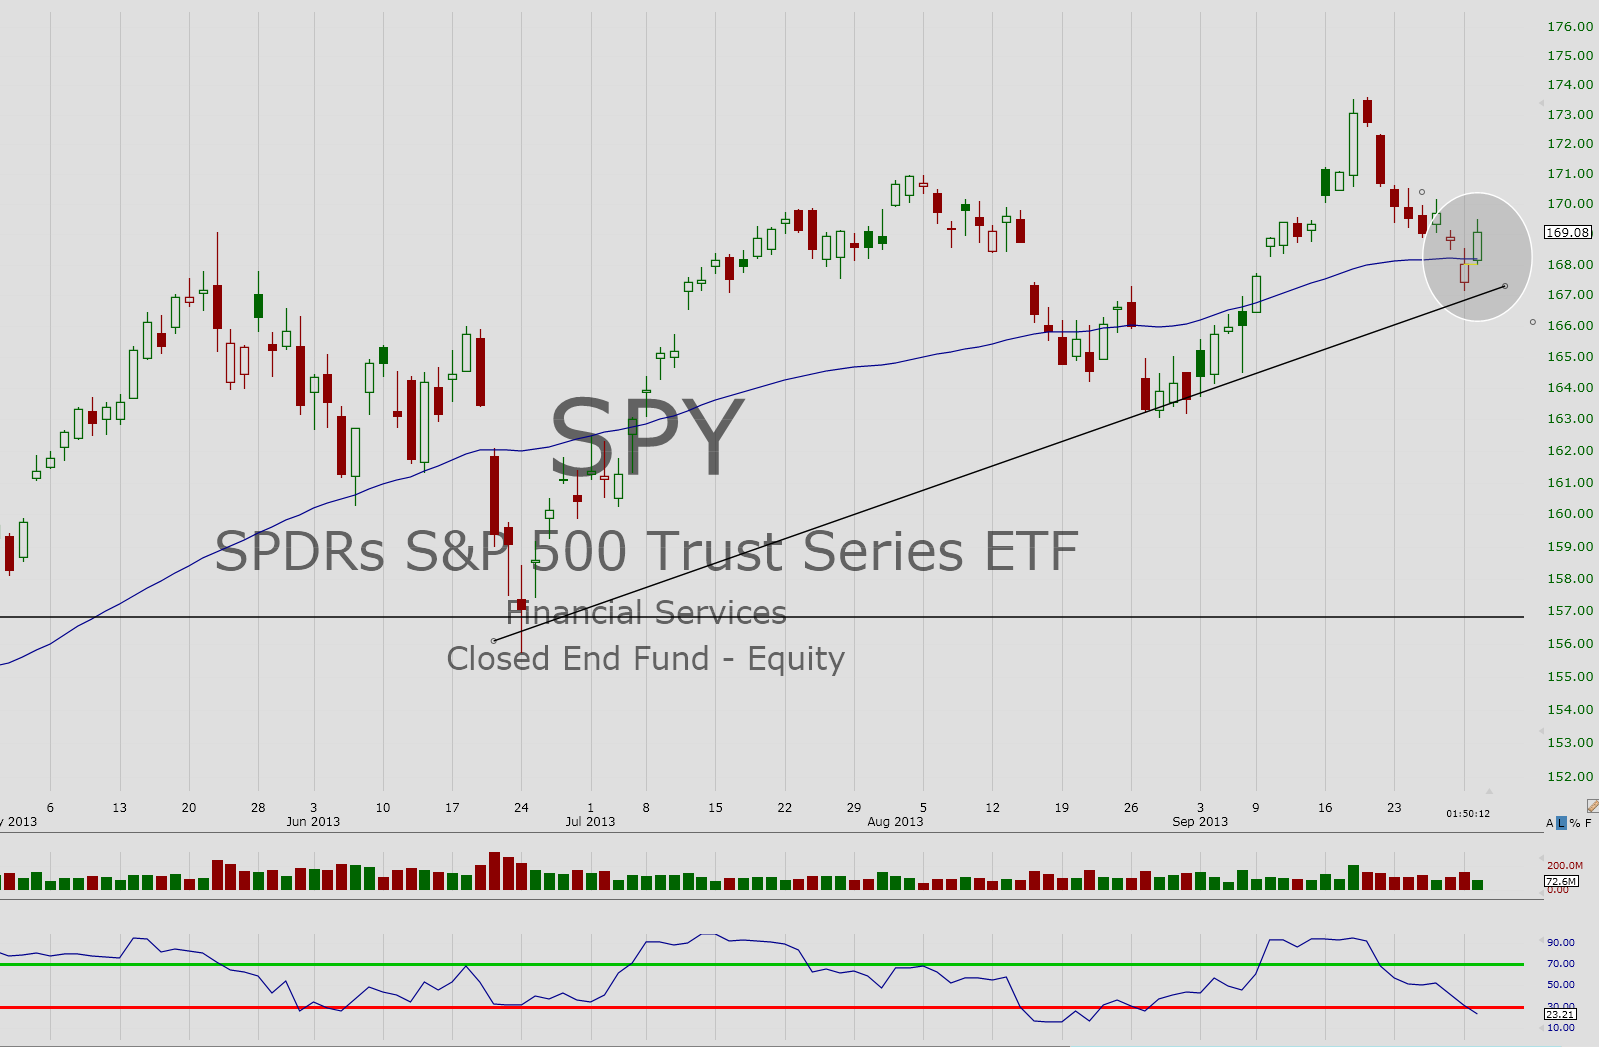

There are many more charts that look like the two above and is just one more reason I feel buying in early October will be a solid strategy heading into the end of the year.
Recent free content from Matthew McCall
-
 MarkETForce Portfolio Update - Major Changes
— 11/11/13
MarkETForce Portfolio Update - Major Changes
— 11/11/13
-
MarkETForce Portfolio Update - Crushing the Market Despite DC
— 10/16/13
-
Do Not Fear the Government Shutdown
— 9/30/13
-
We Welcome a Government Shutdown
— 9/30/13
-
Market Outlook - Healthy Pullback or End of Rally?
— 9/27/13
No comments. Break the ice and be the first!
Error loading comments
Click here to retry
No comments found matching this filter
-
{[comment.author.username]} {[comment.author.username]} — Marketfy Staff — Maven — Member
Want to add a comment? Take me to the new comment box!

- 1 Campus Martius, Suite #200Detroit, MI 48226
- +1 877 440 9464